Saturday, 9 February 2013

Agile software development under TOGAF

Phases G & H: the Architecture Governance Iteration

In a blog post last year, I covered how Agile and TOGAF are perfectly compatible and outlined the similarities that they have.

The title of the post won't resonate much with agilists out there, as the term 'governance' is something that most think of as 'management bureaucracy'. However, the truth of the matter is that if you look at Kent Beck's seminal work on XP and consider the principles and practises section, you'll see that these are in effect, principles and governance guidelines.What I mean by this is probably best illustrated via an example.

Imagine you are an agile QA. In order to adjudge whether or not a piece of software has been developed solidly, agile QA's often carry out the role of checking code coverage and complexity measures and monitor that coverage against metrics defined in their testing strategy. This can be automated and they instantly see a governance measure that they can check against what are effectively their organisational unit's (software development department, say) principles of TDD/BDD etc.

For software developers and architects out there, remember, TOGAF is a much broader and more abstract framework to develop enterprises under (I steer clear of just applying it to software, since it isn't technically a software development methodology. It is an EA framework, or systems development methodology if you look at it through those particular eyes). It covers business architecture, data architecture and technical architecture as well as application architecture and at the highest level, it does this without recourse to any technological concepts at all in those stages (so there are no explicit, detailed references to Visual Studio 2012, SQL Server 2012, MySql, PHP etc.). The aim is to consider the organisation as a whole as a system.

Statics and Dynamics

Any system, in whatever form, only require two high-level concepts to fully define it's operation. These are:

  • Statics - which in the case of business are things like the structures, entities, artefacts, roles, people, systems etc. etc. 
  • Dynamics - How these static elements interact and indeed how the organisation as a whole behaves.
In the world of software, we have seem this many times. For example, the GoF books were split into patterns of structure and those of behaviour and we also have languages to express those interactions, such as UML class and collaboration diagrams. These days, systems thinking is finally making inroads into the software world, despite those of us already familiar with the concepts having used it for nearly 15 years (some of you out there will have used it longer than I have).

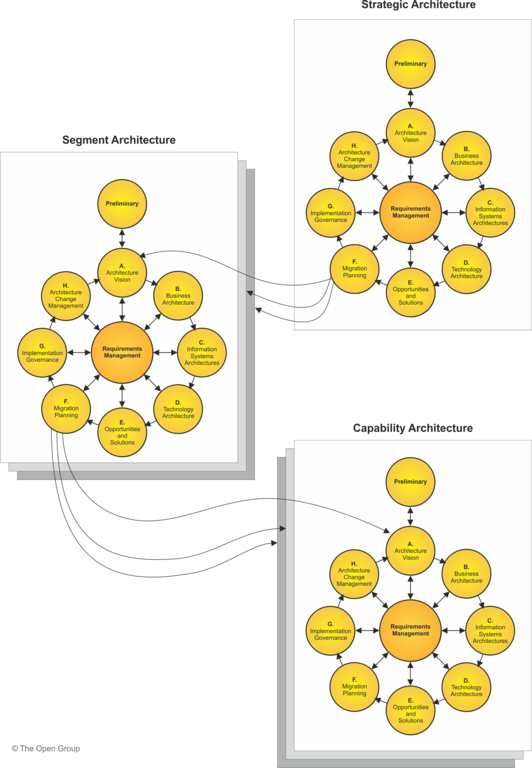
Just like businesses as a whole, you have different levels of abstraction which define the organisation. You can define the system dynamics at varying levels of details and just like you have, say, different levels of UML diagram (use-cases to compartmentalise the operation of a software unit, with activity diagrams which define the functions within it. In themselves, these functions can be another use case diagram's use case, in the case of say, a component or package), the same is true of business. BPMN's ability to run sub tasks is another example of this. However, I don't want to get hung up on the language of expressing a business, as this is different from the business itself.

fig 1 - TOGAF ADM with different sub iterations (from Mike Walker's blog on MSDN, copyright The Open Group)
And just like a business, TOGAF allows different levels of EA for each level of the architecture partition or indeed organisational unit.

fig 2 - TOGAF ADM applied at different levels of partitioned architecture (copyright The Open Group)

How does this fit?

Well, a business is a system. Software is a system. Software development is a system. Everything in this context is just a system. Apologies to people who really hold on to the psychological element of agile methods, but you are being kept a happy cog in a big wheel :-) This is not to say it shouldn't happen, but you are there to develop software at the end of the day. Indeed, remember, you and your team use elements like Kanban to 'manufacture' software just like a they do in a factory.

AGILIST: "OK, stop flaming us! Really, how does it fit?"

Joking aside, during a software development project, you will often use BDD/TDD to develop acceptance criteria and the amount of coverage in these scenarios is your governance metric. Additionally, some agile teams are aware of risks and issues that they have to monitor. They also use metrics to define 'productivity' such as throughput and cycle time They also run retrospectives to continuously improve. Software dev peeps should pay particular attention to phase G in TOGAF gives you all that when defining a system representing your organisation. Software, Business, Data and Tech Architects may be involved in earlier phases, maybe even A to E, depending on the model of TOGAF used at each level of architecture partition. But for devs, phase G of  the ADM gives you:
  • Project name, description and objectives [Project name/Description/Epics]
  • Scope, deliverables and constraints
  • Efficacy metrics [Throughput/Cycle time/Business Value]
  • Acceptance criteria [BDD]
  • Risks and issues [Risk Log]
I have linked the Agile concepts in square brackets. As you can see, we have everything required for the initiation of an agile development project right there. 

Remember, when going through an iterative enterprise architecture process such as TOGAF, there is no BDUF exercise. Each transition goes through an iteration of the ADM, which creates an incremental change to the organisational system as a whole. Within each iteration, at phase B, businesses are architected or rearchitected and IT systems are developed to facilitate that business operation. Same as always. 

Some developers see themselves as coming into play quite late in the process (Phases G and H - last n the cycle). It seems to them that there is a BDUF exercise going on, but really the business is defining itself at the beginning of the cycle. After all, you can't have acceptance criteria defined by the business if there is no business :-)

By contrast, when you get a BDD spec for an existing, well understood business, the business system (with it's statics and dynamics) is already defined for the business owners. They have lived it and worked it for years. The business owner knows what they want and work with the 'three headed monster' (BA, QA, dev) to spec that out in Gherkin for example. In this case, there is no need to reengineer the business to then submit acceptance criteria to the devs. In TOGAF, it is exactly like going through the Architecture Definition Iteration (cycles of ADM phases B to F) with the existing formal baselines already in place, but having no EA change requirement. So you can get through those in very little time and go straight to phase G, which is where these BDD criteria form the acceptance criteria for the IT systems (I appreciate using TOGAF here is overkill, but the point is about illustrating the pattern).

Remember this...

Whilst TOGAF is an EA framework and, say, SCRUM is an Agile software development practise, they both work to define systems. Both are iterative and incremental in nature. They just work at different levels and to some degree, can have very different cycle times. After all, TOGAF would also concern itself with the definition of an organisation's services, people required to carry out enterprise functions within that service, the information (not 'data') they require to do their job, and provide services which may or may not use IT at all (think shop assistants, call centre operatives, cleaners, warehouse staff etc. etc.) and their roles have to be at least understood if not engineered into the business system as a whole. This is something IT personnel take for granted when defining software. Even in RUP they assume actors already exist, but I would say how do they think those actors came to exist? TOGAf is a way of making that happen.

Friday, 11 January 2013

SOLID Understanding

I am actually personally very surprised as to why SOLID principles get explicitly called out for as part of interview processes for both development and architecture roles as if it is a benchmark for capability. What interests me is why this is anything more than the absolute basics of software development. Indeed, I don't even have a prominent place for it in my CV. However, often being both sides of the interview table, I can definitely attest to the difficulty the typical industry candidate at any level has with robust OO principles.

In my anecdotal experience, 85% of developers do not apply SOLID principles correctly, often preferring to  look at shiny toys and tech from other organisations before they get their own house in order. This can often lead to badly used frameworks, poor NFRs etc. However, in my book, this should be so basic it shouldn't even be mentioned on a CV. To an OO programmer, this should be akin to typing. The industry assumes that you work with computers so can type. If you sit in front of me at interview and claim to be an OOP/AD expert, I am going to assume you know the SOLID principles. Indeed, when I test you on your design patterns and your evaluation of what patterns to use when and what anti-patterns you know of or can find, if you don't know SOLID principles it will be very evident. Given 85% of software developers can't do the top end roles, I will be looking for any excuse not to employ you but also, I will be pushing to see how far you can go if you do know them. Hey, it's the way I do things.

So What's SOLID About SOLID Principles?...

Absolutely nothing in my book! SOLID principles have been around for a lot longer than Uncle Bob's coined acronym. I took my leap into the OO style of development in the days of OWL and MFC (the Object Windows Library). In those days we were more concerned with doing the role than shouting about doing the role and we were generally required to be more capable in areas not directly associated with programming. Such as memory management, optimisation etc. which modern developers either don't need to worry about due to abstracting  this away using .NET or Java VMs and dynamic languages or have a different focus on. So to 'know OO' was passé. We would say "So what?"

SOLID stands for a set of 5 principles of good OO-design. They generally follow good system thinking practises anyway. They are:

Single Responsibility

Any class should not have more than one responsibility for one context. For example, a shopping basket class (ShoppingBasket) stores items to purchase from a store. In itself, the shopping basket doesn't do the calculation of the subtotal of the items within it.

You can spot SRP violations by looking for code-smells. For example, the name ShoppingBasketInvoice makes you ask the question, what is it? Is it shopping? A basket? or an invoice? If you see this happen, refactor it!

This principle also applies to the methods within the class. Methods such as:


        public string SumAndDisplaySubtotal()
        {
            //...
        }


The above should first be refactored into Sum() and then Display(decimal value) but this then brings the containing class into focus and makes you ask "Why is this class summing and displaying the information?"

If working code first, you can note they don't belong in the same place and so would extract out the Sum() method into an TillAccumulator class, say, and the Display() into a TillScreen class. Then you can ask the question "Why do I have 'TillAccumulator' class and 'TillScreen' classes?" and so extract out Display and Screen classes into objects which the Till is then composed of.

If working design and contract-first/DbC and think about how the world of your shopping works in real-life.  The Till would Sum the shopping basket items using an accumulating total in an Accumulator and displays this on a Screen. So you can get there that way too.

All these give the benefit that if you need to change something, you can do it in one place, in one context.

Open-Closed 

Classes should be open for extension but closed for modification. This is why we have encapsulation in OO languages. There should be no direct access to the fields within the class and good use of polymorphism and virtual/abstract classes to get what you want out of it (leaving out the discussion of inheritance versus composition, as if devs can't get SOLID, that discussion won't make sense). A non-exhaustive list of ways to make this happen include:

  • Use abstract classes to define the public and protected methods you wish to allow to extensions to.
  • Make everything else private.
  • Definitely don't make all your methods public if you are only ever going to use it internally or in derived classes.

The litmus test is how many classes have to change if you make one change to your programme. This is also the same litmus test you can use for discovering coupling, as the higher the coupling the greater the issue.

Liskov Substitution

In any design, a class should be able to be substitutable for its base class or any derived class from that base class (including derivations of its children ad infinitum). This is a simple one, as it just involves using abstract or base classes (or indeed interfaces) to allow any derivation/implementation of a class/interface to be put in the place of the original abstract entity.

This makes sense mainly because otherwise you violate open-closed (as you have to modify classes inside other classes if you have not injected it) and also cause a lot of work, as you are dealing with very specific cases all the time, exploding the amount of coupling involved. Learning to use encapsulation, inheritance, composition, abstraction and polymorphic techniques will save you a lot of code and time in the long run.

Interface Segregation

This is an interesting one for me. Interfaces are a bit weird. Those without any understanding of interfaces never use them. So this principle never gets applied to interfaces (but can equally well be applied to pure abstract classes in languages that support multiple inheritance). Those who understand interfaces and why Fowler's definition of 'header interfaces' are a bad thing are already most likely using this principle but the ones to watch the most are those who do know what interfaces are and use them, but do not understand header interfaces! They will use interfaces as if they are just abstract classes, which is a huge mistake! Definitely a case of a little knowledge is dangerous.

Unfortunately, the way developers use dependency injection and mocking frameworks tends to encourage (if not forces) them to create these header interfaces and the results can be pointless at best or catastrophic at worst.

Interface segregation aims to classify a class' functionality into role specific 'contract structures' (I refuse to use the word 'contract' as interfaces only solve half the problem, i.e. the statics, but give no indication of the dynamics of the system).

Consider it this way. You are a person, a class if you will. You perform many roles. You are a child, a worker, a parent maybe, a friend to someone (hopefully), a spouse etc. and you interact with the different people in your lives in different ways in those different roles. Each of your faces is the way you communicate inter-personally (See what I did there with the mnemonic? Ha-Haaa! I still got it! :o) ).

So look at your objects in context and determine if you really want to be using that header interface just to mock something and thereby "designing-by-tool" - Constraining the design by what the framework can support, makes you a tool!... (Two from two)

Dependency Inversion

This ties in nicely with Liskov substitution, since you should never depend on the concrete classes you create. So always make a link to the abstract class or better still interface rather then the concrete version of the code. This will massively help reduce coupling but also allow for the Liskov substitution to take place much more easily.

Closing Remarks

Back in the day, this was bread and butter stuff. So know it!! It will help you understand design patterns, develop your own usage of patterns, find anti-patterns, apply code smells, understand why coupling is important etc. etc. etc. It's the basics! 

What surprises me is that even with the introduction of fully OO languages into the mainstream, this has not actually improved OO code that much. Indeed, in the case of the mid-level developer, the introduction of OO languages that force the use of OO, seems to have made that standard worse. I would hope that people actually start to learn these again as part of self-tutorship, degree programmes, programming courses etc. but it isn't fun and sexy (though more now than ever), so it doesn't get the recognition and understanding that it deserves. 

Friday, 9 November 2012

Windows 8 Pro Release...

...has a great uninstall application, as despite the Windows 8 Upgrade Assistant saying everything is hunky-dory, I spent the last 5 hours downloading and installing Windows 8 just to get the 2 screens shown below.

These appeared after the 'usual' Win8 ':( something has gone wrong' screen that I also got in CTP on a VirtualBOX VM, whatever I tried:

fig 1 - First error screen in the sequence


fig 2 - Second error screen in the sequence

It would be interesting to know from people who managed to install Win8 Pro on hardware that's a year or two old as I don't know anyone that's not had any problems at all.

Once installed, most people report a good experience (or at least some good experiences) but it is now 1am after wasting an unbelievable amount of time (and paying the cost of the software) that I won't get back, I am not in the mood to try to fix this now.

If Microsoft wants to compete in the tablet and phone markets with the likes of Apple, things have got to just work! With the diversity of the hardware platforms that it they will typically have to support in that arena, this isn't easy at best, but this certainly isn't the way to do it on a desktop platform they have dominated for a few decades.

I will have to maybe try it on a different box tomorrow. It depends if I can transfer that license across. Otherwise, dummy out of the pram, I'm sulking!

The Working Update

UPDATE: I finally managed to get it installed and working the day after. However, I had to reinstall all my applications (the majority of which were not on the Upgrade Assistant's list) and have still got some to do.

I had to choose to save only my files, not my apps. The BSOD error that was happening previously was coded as 0xC000021A. A quick Google seemed to suggest there were too many options at that point, a problem with winlogon.exe (which seemed to happen a lot in the history of Windows, including XP dying by itself), so I just thought blue word thoughts and installed the thing saving only my files.

Once installed, I am actually quite happy with it. It is very fast compared to Win7 on this box! Though I don't know if this is because I am not running some services which I used to. Apart from that, it is very responsive on my SSD based 3.6GHz quad core AMD Phenom II X4 975X Black edition.

The lack of Start menu was confusing, especially when I instinctively hit the Window key on the keyboard. The Metro interface does seem very simplified and closing Windows in Metro would be extremely long winded if I didn't know Alt+F4 existed. It requires a mouse to pick up and drag a Window to the bottom of the screen (think send it to the grave) or you could move the mouse to the top left hand corner of the screen to bring up the running apps bar, right click and select 'Close' (akin to right clicking an icon in the taskbar on Win7 and selecting 'Close Window').

The same is true of shutting Windows down. If you are o the desktop and choose Alt-F4 this brings up the usual Windows shut-down dialog box. Otherwise it is Win+C or move the mouse to the top right and select the 'Settings' cogwheel, then the power button, then 'Shutdown.' from the resulting context menu, then breathe!

I will continue to play and see where it takes me. There are a couple of annoying elements about Metro so far, but I hope this old dog will learn new tricks with time.

Sunday, 4 November 2012

Chaining risks, the Markov way (Part 1)

This one is a bit of a musing, as it isn't currently an established norm in the world of software development.

I started this blog post with the aim of going end-to-end on the translating of risk information stored in a log or an FMEA into a Markov chain, which would be modelled through an adjacency table which could then be reasoned with. For example, finding the shortest path through the risks and impacts to find the least risky way through the development or operational stages. However, this proved to be a much longer task when running it through step by step.

So I have decided to split this down into a couple of blog posts. The first will deal with modelling and visualising the risk log as a directed graph. The second will then build an adjacency table to reason with computationally and so deal with the optimising of those risks.

Risk? What risk?

During the development of a piece of software, there are a number of risks which can cause the project to run into failure. These can be broadly categorized into development and operation risks.

Remembering that the lifetime of a piece of software actually includes the time after its deployment into the production environment, we shouldn't neglect the risks posed in the running of the code. On average this is generally 85% of the total time of the lifetime of a project, yet we often give the proportion of the risks only lip service.

In either case, we have to be aware of these risks and how they will impact the software at all stages. Most 'new age' companies are inherently their software products and therefore, the risks associated with these products inherently put the company as a whole at significant risk.

I was thinking the other day about the use of FMEA's and their role in the communication process. I tailed off my use of FMEA like processes years ago, but picked them up again in 2011 after a contract in Nottingham. The process is pretty easy and harks back to the yesteryear of House of Quality (HoQ) analyses, which I used a lot and still use to some degree in the form of weighted-factor models or multivariate  analyses. People familiar with statistical segmentation or quants will know this from their work with balanced scorecards.

What struck me about the FMEA, even in its renaissance in my world, is that the presentation of the FMEA, just as with any form of risk log, is that it is inherently tabular in nature. Whilst it is easy to read, this doesn't actually highlight the effects those risks will have adequately.

FMEAs and Risk Logs

An FMEA (Failure Mode Effect Analysis) is a technique which expands a standard risk log to include quantitative numbers and allows you to automatically prioritise mitigating the risks not just on the probability of occurrence and its impact but also on the effect of its mitigation (i.e. how acceptable its residual risk is).

Now, often risks don't stand alone. One risk, once it becomes an issue, can kick off a whole set of other causes (in themselves having risks) and these will have effects etc.

Consider for example, a situation where a key technical person (bus factor 1) responsibly for the technical storage solution, leaves a company and an enterprise system's disks storage array fails or that array loses connectivity. This will then cause errors in the entire enterprise application catalogue where data storage is a critical part of the system, which then loses customer service agents the ability to handle customer data, consequentially the company money both in terms of lost earnings but also in reputation and further opportunity costs caused by such damage to the brand.

A risk log or even FMEA will list these as different rows on a table. This is inadequate to visualise the risks. Indeed, many side-effects of this form of categorization exist. Such as, if the log is updated with the above risks at different times, the log may not have these items near each other if they are sorted by effects or entered at different times. So the connection is not immediately obvious.

What are you thinking, Markov?

I started thinking about better ways to visualise these related risks in a sea of other project risks. One way that came to mind is to use a probability-lattice/tree to expand the risks, but then it dawned on me that risks can split earlier in a chain and converge again later on.

OK, easy enough to cover off. I will use a directed graph. No problem. But then this felt a bit like deja vu.

The deja vu was because this is effectively what a Markov chain is.

A Markov chain is effectively a directed graph (specifically a state-chart) where the edges define the probability and show the system's state move from risk to risk.

This was a particularly important result. The reason for this is any directed graph can be represented as an adjacency matrix and as such, it can be reasoned about computationally. For example, a travelling salesman algorithm can then be used to find the shortest path through this adjacency table and thus, these risks.

I have deliberately used the words 'cause' and 'effect' to better illustrate how the risk log could be linked to the Markov chain. Let's consider the risk log elements defined in the following table for the purpose of illustration:

Risk No Cause (Risk) Effect (Impact) Unmitigated risk (Risk,Impact) Mitigation Residual risk (Risk,Impact)
1 DB disk failure Data cannot be retrieved or persisted L,H Introduce SAN Cluster L,L
2 DB disk full without notification Data cannot be persisted M,L Set up instrumentation alerts L,L
3 Cannot retrieve customer data Customer purchases cannot be completed automatically M,H Set Hot standby systems to failover onto L,L
4 Cannot process payments through PCI-DSS payment processor Customer purchases cannot be completed automatically M,H Have a secondary connection to the payment gateway to failover onto L,L
5 Customer purchases cannot be completed automatically Net revenue is down at a rate of £1 million a day M,H Have a manual BAU process L,M


I have not included monitoring tasks in this, plus this is an example of an operation risk profile. However, if you look carefully, you'll note that the risks play into one another. In particular, there are many ways to get into the 'Customer purchases cannot be completed automatically' or 'Data cannot be persisted' effects. However, it is not immediately obvious that these risks are related.

We can model risks as the bi-variable(r,s),where r is the probability of the issue occurring and s as the impact if the risk occurs (i.e. sensitivity to that risk).

The values of these bi-variables are the L,M,H of each of risk and impact in a risk log or FMEA (in the latter case, it is possible to use the RPN - Relative Priority Number - to define the weighting of the edge which simplifies the process somewhat).

Taking the risk component alone, this will eventually be used as the elements in an adjacency table. But first, to introduce the Markov chain. Obviously, if you are familiar with Markov chains, you can skip to the next section.

Markov Chains. Linking Risks.

Markov chains are a graphical representation of the probability of events occurring, with each node/vertex representing the state and the edges the probability of that event occurring. For each node in the chain, it must have the sum of all probabilities leaving the node equal to one. Consider this the same as a state transition diagram, where the edges are the probabilities of events occurring.

In a Markov chain, every output has to total 1. Thus you have to show the transitions which do not result in a change of state if applicable. If a probability is not shown in the risk log, then it is not a failure transition (thus is is no issue) so you include that as 1 minus the sum of all outgoing transition probabilities. Effectively letting any success on a node loop back on itself.

If we set low risk to be 0.25, medium 0.5 and high 0.75 with critical risks at anything 0.76 - 1.00, Then the following diagram shows the modelling of the above risk log as a Markov chain:
Fig 1 - Markov Chain of above risk log

To explain what is going on here, you need to understand what a Markov chain is. A little bit of time reading the wiki link would be useful. However, basically, combining all the state effects together, we have built this chain which shows the way these effects interplay. With each effect, there is a further chance of something happening which then leads to the next potential effect. From the above network, it is immediately clear that some risks interplay. Often, the risks which have the most lines coming in to them need to be mitigated, as any of those incoming lines could cause that state to be entered.

The results can be analysed straight from this. Given each risk is an independent event to any other, the probabilities can simply be multiplied along the chain to the target. We can ask questions such as:

Q: What is the chance we lose 1 million GBP or more?
A: This particular chain only contains nodes which have only 2 types of event emanating from it. Thus we can deduce that the effect of losses can happen from any of the working states through the chain, but there are two ways to work this out. The long winded way which is to follow all the chains through, or use the short winded way which is to look at the situation where everything is working and subtracting this away from 1, to give use the chance of losing 1 million GBP a day. Because I am lazy, I prefer the latter way, which gives:
The latter way also takes into account more than 2 exists in each node. This is particularly important when there may be 3 or more risks that could happen at each chain.


Q: What is the effect of a failure on the DB disk?
A: By following the chain through and expanding  a probability tree (wiki really need someone to expand on this entry, it's rubbish!), assuming the disk has failed, we get:

chance of missing customer data = 100%
chance of lost purchases = 50%
chance of loss of £1 million or more = 25%

The reason for the latter is:

Summary

Although I have not used these in earnest, I am keen to look at the use of Markov chains and will be exploring the use of them when transformed into adjacency tables for computational purposes using linear algebra in the next blog entry. 

Markov chains are widely used in analytics/operations research circles, so it would be useful to see how they apply here. But already from this you can immediately see how the effects interplay and what sort of reasoning can be accomplished using them. This shouldn't be too new to those that have studied PERT, six sigma and network analysis techniques in project management/process optimisation courses, as they are effectively practical applications of this very same technique. Indeed, a blog I did a while back on availability is a practical example of this at system level.

To be continued :-)

Thursday, 13 September 2012

Which came first, contract or code?

Another recurring theme that I keep seeing time and time again on my travels is the debate between communities about which should come first. Contract or code. I see a place for both in service development and decided to explore the reasons for why that is.

Code-First Development

Code first development is defined as delivering a working system, refactoring and splitting the code ito a separate subsystem along a 'natural' boundary. At this point, the teams themselves can be split into two, one for either side of the service contract.
Consider a fabricated shopping basket example. A simple shopping basket is developed as one monolithic and to end function, which sums the prices of the items in them, calculates the tax on the order and renders itself on screen.
A step in refactoring may introduce an MVC pattern and split out the tax calculation using a strategy pattern.
Once split, the taxation interface may be considered a separate domain, natural to split on. The team itself then splits too, with some members then going on to work on the taxation service whilst others remain on the web component.

fig 1 - Code first development
This is the method normally advocated by XP and SCRUM proponents.

pros:

  • Knowledge of the contract doesn't have to be agreed up front - The contract is defined by refactoring to it and emerging the design over time.
  • Team size can be small, then increase until a natural fracture point in the architecture necessitates the split of the code and the team. This maintains Conway's law.
  • Delivery is assessed by acceptance criteria associated with end-to-end business processes.
  • Very useful for delivering software where the business process is not fully known.
  • Delivers more optimum results inside departmental systems.
cons:
  • Breaking changes where split teams do not communicate effectively is higher.
  • Where end-to-end business value is outside the scope of the development team, or they do not have full control/visibility of the end result (such as interacting with COTS systems) and the success criteria doesn't account for they integration work, this can be difficult to get right and the service contracts may not match actual expectations.
  • The services do not evolve to represent the business value until later in the process - message passing between departments does not necessarily evolve from the microscopic view of the role of the technical contracts.
  • Cross-team communication is essential, so the split teams will have to sit near each other to communicate effectively. As the service catalogue grows, this becomes a much more difficult task.
  • Can miss the wider optimisations as the bigger picture is never addressed during 'emergent design'. The resulting optimisations are effectively sub-optimal at the organisation level.

Contract-First Development

By contrast, contract first development is delivered from the identification of messages flowing between the business functions, utilises techniques such as design-by-contract to define message and service contracts between the departments and their systems, which then become the acceptance criteria for the code developed by different teams independently on either side. Automated validation is performed on both sides against the contract using service stubs and a standard interface definition (such as an XSD).

An example process might be:

fig 2- Contract first definition
pros:
  • Architecture and management, who know the bigger picture of the organisation (if one exists) can help define the detail of the business process and hence, contract obligations.
  • Both teams can work independently at an earlier stage and get to a standard contract definition much quicker.
  • Very useful in static, well defined companies with well defined departments and divisions.
  • Much easier to apply Conway's law.
  • Better placed to provide global, enterprise level optimisations - Since similar messages and interactions can be identified much easier as people are looking at it.
  • Contracts provide very well defined, technical acceptance criteria which can be applied to automated testing very easily.
  • Non-development managers and senior managers in structured companies can identify with this method much easier.
cons:
  • Requires a joint design activity up-front to establish the form of the contract and solution.
  • Requires enough big picture thinking to effectively establish the inter-departmental contracts.
  • Not well understood or appreciate by the majority of purist agile developers who are often not concerned with the bigger picture.
  • Less scope to evolve the contracts, so worse for more fluid organisations where the business process is not known up-front.

Summary

The above non-exhaustive list of pros and cons should help guide the development and/or architecture teams on when to use which method. One day I hope to add metric to this set, such as using a multivariate model to  evaluate companies against this. It would be interesting to see if the community at large already has a similar way to define this. So drop me a comment if you do.

Sunday, 2 September 2012

The great, smoking pause...

As is often the case when I consult in the city [of London], I find my commute sucking up a large proportion of my day. In this instance, I lose almost two extra hours in productive time, which leaves me with little time to blog about anything.
I still have to finish my XP (2nd edition) review and also introduce some elements of process optimisation too. So if interested, stay tuned for that.

Also, to answer some questions sent to me recently, I am going to be comparing contract-first and code-first methods of developing service interfaces.

Fingers crossed I find time to properly write these up.

Sunday, 29 July 2012

What's the Point of Failure?

I am taking a bit of a break from writing up XP 2nd edition and am going to concentrate a little on some statistical analysis of single points of failure and why they are a bad thing.

This is particularly relevant in the infrastructure domain, especially with the introduction of data-centres over the years and given the increased importance of IT in large enterprises, I felt that I should cover some of the fundamentals of why we use redundant systems. This is especially important for companies who deliver PaaS infrastructure and was very lightly touched upon in the fairly recent Microsoft cloud day in London (Scott Guthrie didn't do any maths himself to prove the point).

Mean-Time to Failure and Uptime

Every hardware system has a mean time to failure MTTF. This is calculated from a series of runs, where the time taken for a system to break or error is calculated from a couple of dozen component runs. Then a mean failure time is calculated from those results. 


System vendors use these uptimes to then give a warrantee that minimises them doing work for free but gives them a certain confidence to be able to offer that service as SLAs or to concur with legislative frameworks (given the risk of something happening increasing the nearer you get to the MTTF).

In the case of data centre/server room infrastructure, these mean times to failure, when apportioned by year/month or whatever, can indicate the uptime of the system component. SLAs for uptime are then delivered on adjustments of that.

For example, if a router has a mean time to failure of 364 days of always on use (which is realistic in a lot of cases) then the uptime is a day in every year, which is also known as (100 * 364)/365 = 99.726%  uptime. You can statistically model this as the probability of the system being up in a year.

When you combine a number of these components together, you have to be aware of the uptimes for all components and also be very aware of how those components interact. In order to understand the uptime of the whole system, you have to look at the single points of failure which connect these systems to the outside world.

How many 9s?

It has always been touted that if you increase the availability of a system by a '9', you increase its cost ten-fold. Whilst correct as a heuristic, there are things you can look at to try to improve availability on the infrastructure you already have, without necessarily spending money on extra hardware. We will investigate total costs and what this means for cloud providers or data centre operators at a later date, but for now, let's look at an example.

Imagine a network structured like the following:


fig 1 - Sample Network

Where the 'l' represents levels at which the uptime can be calculated. We can state that the uptime of the system can be determined by the intersection of the uptime of all relevant components at each level.

Basically, this converts to the following equation:

eq. 1 - Probability the system is up

This generalises at any level because it is effectively a probability tree, where each element is assumed to be  independent from the levels above or below. This is not unreasonable, since if a router goes down, whether or not the server underneath it goes down is another matter and is not usually affected by the router. So we can further define:
eq. 2 - Current level availabilities are not 
affected by higher or lower level availabilities

Technical Note: This assumption is not true with power supplies, since Lenz's law defines that the Newtonian equal and opposite reaction to a power supply switch/trip is a surge spike back into the parent supply and potentially into the same supply as the other components. However, to keep this example simple, we are concentrating on network availability only.

So to illustrate, consider the components of the above network to have the following availability levels:
  • Backbone router 99.9%
  • Subnet Router 99% (each)
  • Rack 95% (each)
  • Backplate 95% (each)
  • Server 90% (each)

Let us look at a few different scenarios. 

1. Single Server availability
The simplest scenario. A whole site is deployed to one single server in the data centre (or pair of servers if DB and site are on different processor tiers. The bottom line is if any one of them go down, the whole site is down). The availability of the site, for this simple case, is given by the product of the availabilities of all components as we go up the tree from the server. So:

eq. 3 - Single Server Availability


2. Triple Server Availability
OK, so we have an 80% availability for our site. Is there anything we can do to improve this?

Well, we can triplicate the site. Imagining this is done on the same backplate, we now have the following network diagram. I have not purchased any extra hardware, but have purchased more computing servers.

Note, the red components indicate the points of failure that will take down the entire site.

fig 2 - Triplicated site, same backplate component.

In this case, we have to look at the probability of at least one of the servers staying up and the backplate, rack, subnet and backbone routers staying up. If any one of those levels fails, then the site goes down.

This is only a very slightly harder model, since we have to take account of the servers. Availability is determined by any combination of one server down and the two others up or one up and the two other servers down or three servers up. 

This can be quite a messy equation, but there is a shortcut and that is to take the probability that servers all will be down away from 1 (i.e. 100% - probability of the failure of all servers, 1, 2 and 3).

For those with A-level equivalent statistics (senior high in the US for example), you will know that all the combinations of this server, that server, up or down etc. can be simplified into the compliment of the probability that there is no server that can service the request. This means that the first level availability probability is defined as:

eq. 4 - Triplicate the web application, level 1

The next step is to multiply this out with the availabilities in the same way as previously. This gives the following:
eq. 5 - Total availability

So triplicating your applications alone results in an improved availability of almost 90%. 

But we can do better!

3. Different Backplate Routers
If we assume we can place servers across two routers in the rack, this changes the availability once more, since the level 2 probability now encompasses the two backplate availabilities. Be aware we have not actually added any more cost this time, since the 3 servers already exist in scenario 2. So can we improve on the availability just by moving things about?

fig 3- Triplicated site, different backplate router components.

The probability of at least one server being available is the same as in scenario 2. What is different is the level 2 probabilities. 

In this case, the probability of no backplate router being able to service the request and the resulting total system availaibility is:
eq. 6 - Level 2 availability and system availability

So just by doing a bit of thinking and moving things about in the data centre, we have given us an extra 4.68 percentage points of availability for free, nought, nada, gratis! :-)

Did we do better? Yep. Can we do better? Yep :-)

4. Across Two Racks
Applying the same principles again (this is a theme, if you have not got it already). We can distribute the servers across the two racks, each using the other as a redundant component, leaving the following configuration:

fig 4 - Different Rack Clusters (3 different backplate routers)

Here, the configuration is set up to only have the subnet and backbone routers as single points of failure. The two racks would have to fail, or the three backplate routers, or the servers all have to fail for the site ot be inaccessible and the site to go down completely.

The process is the same as before, but on two levels for the backplates and racks. This gives us:

eq. 7 - Level 2 & 3 availability and system availability

We definitely did better, but can we improve? Yes we can!

5. Two Subnets
Using the second subnet as the redundancy for the first whole subnet we get what you must have guessed looks like:
fig 5 - Different Subnets  (3 different racks)

The probability of failure for level 2 is the same as the previous configuration, 3 and 4 get modified and the total system availability is now:

eq. 8 - Level 2, 3 & 4 availability and system availability

Summary

As you can see from the above results. If you have the infrastructure already, you can gain an impressive amount of failover resilience without spending any more on infrastructure. Simply moving the site(s) around the infrastructure you have, can result in gains which others would normally tout as requiring 100 times the investment (such as in this case, where we moved from zero 9s to two 9s). This is not to say the heuristic is false, just that it should be applied to a system already optimised for failover.

Additionally, the introduction of power supply problems (as mentioned in the technical note) means that the probability at each level

There are two more elements to look at. Scaling the technical solution and the costs involved in that scaling. I will approach these at a later date, but for now, look at your infrastructure for servers hosting the same sites which share single points of failure and more them around your servers. 

An old adage comes to mind 

"An engineer is someone who can do for a penny what any old fool can do for a pound"


Happy Optimising! :-)