Showing posts with label Agile. Show all posts

Sunday, 22 November 2015

Revisiting the Cone

In a twitter discussion with folk on the #NoEstimates thread again (I don't know why I go back there) Henrik Ebbeskog (@henebb) stated there is no reason to fix time. Absolutely, and as mentioned to others though, fixing time means the other dimensions of software delivery [are allowed to, or must] vary. This isn't a surprise to most of us in the agile space, nor is it a surprise to management scientists either.

As part of the discussion, Henrik mentioned that you could fix time to 1 second and it reminded me of a discussion I once had with an old Senior PM (at the time), Duncan McCreadie. It centred around agile development some 5 years ago and in the discussion, he stated that if he wanted to monitor an realign the delivery, he'd look to bring delivery rates down to every day or every 4 hours. He was spot on with this and I agree.

The reason is in part due to the Cone of Uncertainty I keep banging on about mathematically, and even get heckled at, but that doesn't change the math, nor does it change the empirical numbers, which also back it up.

Why Delivery Rate Matters

If you deliver software continuously, each delivery gives you knowledge about your process that you didn't have before. What has happened, has happened, you can't change that, but you can both learn from it and consider it's variance zero (it's happened - there is no variance, it's a certainty) and if you are, then make things happen faster.

This is like I illustrate in:

http://goadingtheitgeek.blogspot.co.uk/2014/10/cone-head.html

In essence:
You've delivered a coin flip. It's now become known and in a fixed number of delivery cycles, this changes the expected outcome for all coin flips and it's potential overall variance.
Each flip of a coin is a delivery. Now, substitute the words 'coin flip' with 'story' and 'all coin flips' to 'major release' and reread the above.

As you can see from the graphs of actual project data shown at:

http://goadingtheitgeek.blogspot.co.uk/2015/04/monitoring-value.html

This applies across the board. There isn't a real delivery process in the entire world which doesn't follow this rule. The only possible case, is if the process extends to infinity, since this just pushes out the variance to perpetuity, which follows the last [sketched] graph at:

http://goadingtheitgeek.blogspot.co.uk/2015/04/lean-agile-metrics-like-it-or-not-stats.html

However, you'll note that nothing exists to infinite time. Even the Universe isn't considered to be able to exist at infinite time and I'd argue that your project budget would run out before then. Using faster monitoring approaches, as well as employing lean architectures, you will make the most of that budget as well as making it easier to either align or find a new direction.


E

Sunday, 19 April 2015

Lowering Chances, Mitigating Risks or Both?

I was talking at Lean-Agile Manchester this week. It was a choc-full event which necessitated the adoption of extra chairs.

A number of the XP Manchester folk were in, which is always entertaining, since the two groups have overlapping common interests but as with many agile vs lean schools, we don't necessarily come to an agreement on the best way forward for things.

There were some great questions through the night! Including the ones form the hecklers. It centred around data from some graphs I showed from a previous blog post tried not to go into the maths of due to the typical spread of the audience. So I offered to take it offline so as not to bore the audience, but there wasn't the appetite form the questioner, so smackdown happened and they then agreed to take it offline but never got back to me, darn it! (#invitestillopen)

Background

What's the reason for the graphs?

Several years ago, I was working in a company which was on the proverbial agile journey. They were still thinking in very big-design ways and were managing programmes of work through standard programme and project management methods. The company's attempt to have conversations around agile programming were not really working and the second attempt at them (i.e. just do the work and they will come) didn't reach far enough for anyone in positions of enough power to take the effort seriously. This resulted in a somewhat disconnected hybrid method which saw lower levels doing the work with upper levels of management and EA imposing design on the teams, with PMs backing up the EAs as authority on that work.

In addition to that, teams spent the vast majority of retrospective time generating new ideas for working together (good, bad, change) including grouping tasks, voting and setting options for the next iteration. However, no retrospective ever came back to check that these did indeed improve the process and any overhead we introduced as part of the each task was actually worth it. Further actions just built on top of these actions and you gradually built up greater overhead in each iteration.

The team had successfully implemented WIP limits (though that started off quite painfully) and were measuring cycle time and throughput since this was easy for them to visualise in a JIRA Dashboard. We saw a burn down but it wasn't clear whether our flow was any good and indeed, whether we were improving at all.

Add to this the need from classical project management to get an idea of the length of time things would take as well programme management to align the streams of work meant we had to get to know something about whether we can actually hit the hard deadline. Those that know me know I think aligning work the SAFe way or classical PERT way introduces inherent risks, but the environment was what it was and each change begins with a small step, not a 'Big-Destroy Enterprise Programme'. After all, as a dev, you're an easy replacement anyway to that style of culture (not that you necessarily have to worry about it in the IT game but it's an important consideration).

Who wanted it?

The graph/points estimation wasn't necessarily to get the team to improve delivery per se. That was not the purpose of the exercise. It was to give confidence that when we were challenged to produce an estimate, we could do so reliably and provide some confidence to the supporting classical thinking personnel we're talking to that we can and have delivered x features in t. It was to lower the variation and give confidence to those who wanted to support us that we could deliver and were improving. This was a tool to help them do that and get the buy in they needed, which took half an hour a week for someone to do (indeed, I did it - but any scrum-master or tech lead can do it in an enterprise context).

Why should you care?

The answer depends on the context you work in. In an agile-sympathetic environment, this isn't really necessary at all. After all, everyone is confidence and comfortable with change. However, where a hybrid exist or companies are transitioning, sometimes these conversations are necessary. Later on, they may not be relevant any more. Enterprises can evolve as much as people do.

The Follow-up Questions

During the talk, some questions were asked and I agreed to produce some follow-up graphs from the data. In order to understand some parts of this, I'd suggest you go back and read the method presented in that blog post, as this will explain what look like 2-pt and 5-p story 'anomalies' as we shifted our understanding of story sizes.

Cone of Uncertainty - Variation Over-time

Specifically, taking the variation between our expectation and actual delivery, plotting it and calculating the Coefficient of Variation to standardise the scales of the graphs, we can plot the change in the coefficient over time. What we see for each story size (in points) is this:


Story point variation (CV) and polynomial trend line

To keep things simple(r), I've added a cubic polynomial trend line to illustrate a smoothed variation. I haven't done anything else to the trend line and Excel has chosen the shape that minimises the sum of squares. We can relate actual uncertainty to the variation in story point figures. The same downward trend on variation is seen in linear and logarithmic trend lines. As you can see, most trends show the reduction in uncertainty as we recalibrate our positions.

Limitations

The only exception to the general trends are the 8-pt story sizes, which curve slightly upwards (not significantly enough over linear to be concerned about). Additionally, due to the team rightly reducing larger 13 point stories into smaller stories, there are only a few 13 points stories in the dataset. I argued there were not enough to come to a conclusion or indeed worry about going forward, especially most became 8-point stories as a natural part of story splitting and recalibration (again, read the previous blog post).

Conclusion

As I explained in the talk the other day, estimation such as this isn't an end goal. This is a technique in the repertoire to provide confidence for those who can support us to become more agile. After all. working in the Enterprise Architecture space necessitates communicating in many different companies, with many different types of stakeholder, including non-technical personnel/those without a software development background. Not ever EA problem is a software development problem. Indeed, to approach it from that perspective architects before it's necessary, if it needs it at all!

Digression

As an example, consider walking skeletons, which can be just as problematic in code, since they make explicit choices on the technology stack way before a decisions is needed on the suitability or otherwise of the tech, but they are useful tools to experiment when you have a tech stack already and gain certainty. However, employing just a walking skeleton is like having Maslow's Hammer. It risks introducing technology into a non-existent current stack when the basics of what people want are unknown. In this case, you don't need a skeleton per se. Just throw together a UI mock up and deploy that to a static environment (even a file system) to get people using it to input data that never gets stored. This can be done in a few minutes compared to creating a walking skeleton which can take a couple of hours to get the same amount of feedback and can be potentially constrained by infrastructure problems and will require some prerequisite work. So bang for buck, if the question is trying to find out of Henry Ford's customers wanted faster horses, this would be cheaper to do than a walking skeleton and yields just as much value. The second meeting can fill this out with a skeleton if you want, since by this point you have more information to base choices on.

Risk and Sensitivity

You have two non-mutually exclusive choices to deal with risk. The first is to reduce the chance of it occurring, which this technique fits into. The other is to mitigate the impact should the risk occur. Which this doesn't address and isn't intended to. So this can only be one of many tools in the team's arsenal in dealing with tracking, recalibration and risk reduction and as we can see, there are specific scenarios this addresses really well. The question is, what other techniques exist to address the same problem?

Further Updates

I will answer some of the other questions in time and post them as updates to this blog.

Thursday, 28 August 2014

Drawback of Shared Service: Part 2, Improving on Shared Services

A month or so ago I wrote about some of the biggest drawbacks of shared services in today's market. There are folk out there who make their living delivering these shared services, so I was approached and asked why I felt such a need to denigrate them. That wasn't really the point of the blog and perhaps I could have phrased the somewhat 'tabloid' headline better, especially when I cited them as Evil (which in an accelerated delivery sense, they are but are so nice to reason with, even in purely SOA circles). However, it also became clear that mapping the flow of work through  business hasn't really been done by some in that camp before and hence they didn't have visibility of the actual flow of work through the system.

Kanban and visual management really helps make explicit the work that is goign on. Plus, shared services are only evil in agile and optimised worlds, where the fitness of a company is ingrained in a company's need to adapt and deliver at a fast pace. They form bottlenecks and hence constraints in traditional systems, even if they themselves deliver things quickly (i.e. they are suboptimal). The focus of the last blog was on these systemic issues, not on the individual services and I assumed that the shared services were in themselves optimised. Don't forget, constraints are a natural and expected concept in Systems Thinking and indeed, form a critical concept in the Theory of Constrains. When systemic problems they bring are solved, they are something I and anyone else working in business optimisation positions should be aware of and then look around to see where the constraint has moved to, because they will.

Revisiting Shared Services

Shared services are a stand alone service in a company. They may or may not have budgetary and reporting functions, may have all the elements to deliver a service end-to-end in their arena or perhaps most optimally, deliver business features to other services. They are often characterised as having one accounting cost centre, even if they cut across multiple skill-sets.

For example, in one company, an IT shared service may not have budgetary and HR control consist of:

  • Distinct Tech Support teams - With management
  • Testing teams - With management
  • Software Development teams - With management
  • System Operations/Technical/Network services teams - With management
  • Overall departmental/service management


In another company, their IT service may consist of:
  • Distinct Tech Support teams - With management
  • Software Development teams consisting of DevOps, BAs, QAs/testers - With team leads
  • System Operations/Technical/Network services teams - With management
And management of each team has budgetary responsibility etc.

And indeed, it could be fairly mature and have teams that delivers end-to-end ad support the application.

Getting teams to be more effective inside the bounds of a shared service is a noble goal, but the problem is the constraint then shifts to being a systemic problem, which is what I illustrated last time.

Is Optimising Shared Services Useless?

Not really. If you are moving from a traditionally hierarchical organisation to a flatter, leaner more agile one, it can be a very useful first step and indeed, almost always is. Just getting everyone in the same team who is responsible for delivery in that shared service ad visualising the work they are each contended for is an incredibly useful way to see how they are being pulled from pillar to post. 

However, further down the line, this ceases to yield any significant improvements in value delivery, simply because of the contention on the service as a whole.

If I had to provide my top-4 tips on how to transition from traditional shared services to lean, multifunctional teams, they would have to be:

1. Pick a Stakeholder's Departmental Concern 

Start with the needs of a stakeholder and map the flow of their end-to-end tasks through the entire organisation, noting the departments and functions it touches. 

This often manifests as perhaps a customer entity which starts as a form on a web page, then becomes a record in the DB, then becomes a task for an engineer to come out and do and a conversation that a customer has with a call centre representative when they register an account once the work is completed etc.

To illustrate this through a well known medium, in IT, this can often manifest as the ALM process, for example:

Mapping a sample software ALM to departmental functions

Once you have that list of departments for each individual journey, get everyone in that journey into one team. That way they are all aligned to that one value chain. Note the responsibilit numbers above and the team members below:

Collating members of the value chain into one team

2. Map & Optimise Implicit factors & Visualise EVERYTHING!

These are often 'invisible' supporting functions, such as internal technical support, network services, software licensing, recruitment of team members, capital expenditure for servers etc. These have an impact on the performance of the team, especially in delivery. 

Perhaps the most famous of these is the move to DevOps from SysOps, especially when capital expenditure for servers has traditionally taken a long period of time. First the server is specified, then it is requested by tech services, finance have to approve it, tech services have to build it, SysOps have to provision it on the network, then the system is deployed on to it before going live. Each of those context switches (which is effectively what it is for the server being switched) takes a significant period of time. 

Changing Capex to OpEx (e.g. by using PAYG Cloud Services) especially those coming in under delegated departmental financial authority (especially with the team accountant now being on board) then removes the need for the finance context switch and authorisation to occur, reducing the amount of items in the finance 'to do' list at the same time. This then means that SysOps/Tech services can provision services without the need to get finance authorisation, which is a significant enough saving, as it in turn reduces the lead time but also, if the SysOps staff members are then brought into the development team, this means the development team can then take the technical parts of some feature from inception to live without having to go outside the team, reducing the number of blockers they can't solve.

This can also be applied to HR, facilities, engineering etc. as long as the value chain make sense and the majority of their individual contribution is to this value chain and not some other.

3. The Value Chain is your alignment!

Overlay the journey in tip 1 onto your value chain. Make sure they match and identify and integrate where they don't. The actual journey is what you deliver, not the slide deck the value chain is present in, so that is your starting point and takes precedence. This gives you an aligned enterprise architecture baseline.

After that, look to transition to what your value chain 'vision' looks like on the slide deck, because I bet they don't match :) If you are lucky enough that they already do, or you've done the transition, make sure you're delivering the best value you can. That means revisiting the value metrics and seeing if there is a way to improve them. Chances are just aligning everyone will deliver improvements in itself, but there is always room for more :) 

For example, delivering faster improves financial metrics such as ROR, IRR and NPV which also improves ROI indirectly. Delivering predictably, reliably and with high quality reduces the need for contingency and some BAU processes. 

4. Munge Carefully, one change at a time!

When absorbing functions into teams, make the changes gradually. As usual, smaller changes are easier to integrate than larger ones ad this goes for people too. Smashing two tribes together only ever causes fights, so it is useful to be mindful of the psychology of folk. Indeed, in a lot of cases, most people take to the idea of being an team's authority really very well, even if they are reticent to leave the department they started in.

Conclusion

Creating Shared services which are fully self contained and are aligned to business value are the first step in what could be a long journey for some companies. It also has a very short shelf life, since they will get split and amalgamated into thinner verticals. As you can see fro the diagrammed example, we didn't map every single type of task each department had to do, just the ones that started a vertical and then overlaid the extraneous tasks over the top through implicit tasks which appeared as we looked at each journey.

There are many more tools and techniques which can be used to decipher the actual value chains, including some that can apply here. However, for brevity, hopefully this provides a reasonable start. Also, look into mapping the systemic flow of tasks, but do so for all tasks in the system. If you are looking for a reasonable primer on Systemic Flows, see Ian Carroll's blog for a really good start and primer in synergistic fluency.

Sunday, 17 August 2014

Q: What Do Agility & Astrophysics Have In Common?

There is an agile coaching game called the static points game. It's an extremely useful illustration of how complexity evolves from really simple rules which in the enterprise world, shows how businesses always change under multiple forces, which should be familiar to those in the change management space. I've played it twice, the first was an introduction by Ash Moran whilst I was at Laterooms.com and more recently with Ian Carroll. It's pretty simply, to play:

  1. Get everyone to stand up and move to the edge of the room (or form a circle if the room is too big) 
  2. Tell each person to pick two other folk from the group 
  3. The simple rule is to stay equidistant (the same distance away) from both of them. 
  4. Then let them go.

What you'll see is the group organise and shift about, jostling as the distances come to an equilibrium, then eventually settle. You can play it again, telling people to keep the original two people,  and see where they settle this time. Chances are they settle differently from where they did previously (a digital camera might and high angle come in handy for this variation of the game :).

Reset the game, and with everyone keeping their two folk, fix any one person from the group where they are, perhaps using a chair and send everyone else back to the edge of the room and play it again. They settle quicker. Do it again with that one person fixed, and photograph. You can keep fixing more and more folk and the organisation comes to settle much quicker, with much less movement.


What does this Illustrate?

As an abstract systems game, it naturally covers a multitude of arena!
  • How departmental level business changes relative to other departments as politics plays a part in how departmental heads compete for work or pass blame. Imagine the people in that game are working in an organisation and trying to balance the needs of two sets of stakeholders.
  • How uncoordinated systems work with one another as they evolve (which I believe is what you think this refers to here). Imagine the people in that game are subsystems taking with interfaces to two other systems.
  •  How uncoordinated work-streams work with one another as they evolve (in agile environments, this is what I think happens with shared systems. They pull against the shared systems). Imagine the people in that game are subsystems communicating with interfaces to two other systems.
  • It shows how complexity can manifest from a really simple rule-set. This one is self-explanatory. Intelligent agents (i.e. people, bees etc.) using a really simple rule can still produce a significant amount of very complex behaviour. This, like all the rest, is called [mathematical] chaos.
  • It shows that relationships are easily equally as important as the entities themselves
  • How organisms relate to one another
  • It is a manifestation of planets being influenced by each other’s gravity
Mathematically speaking, they are ALL a manifestation of what is called the n-body problem. The planetary example that ends that list above is where this originated.

A Lesson in Planetary motion

We orbit the sun because our mass is significantly less than it. The effect we have on the sun is near negligible. This is like a big CEO of a company, keeping things in order by imposing forces upon the lower weighted levels, who can’t respond in any meaningful or significant way. However, the behaviour of the system is predictable and has been like that for billions of years. With the big, overarching, autocratic CEO (or C-Suite) in it, and with the absence of any other influential factors, the environment rarely changes, so there is no need for it to change. That is one sun and several planets and moons and their orbits (statics and dynamics) that systemically stay the same for millions if not billions of years, even if what goes on on the surface changes. As far as systems are concerned, architecturally, these are all static points. That’s a high level block diagram!

However, in agile environments, you are empowering folk, quite rightly. Hence, the gravity they have and are allowed to have, relative to the system, is much higher. However, returning to the n-body system, If you have two equally weighted planets orbiting around each other, they will pull each other’s orbits. If you have three orbiting each other, it has been proven that the behaviour of an unconstrained system, is near unpredictable aside from very restricted contexts (i.e. akin to how often waterfall delivered on time and on budget, which some would argue has the same probability that our solar system came into existence the way it has :) Plus, because the class of problem is the same for all of the above, this chaos or ‘randomness’ applies to all of the above examples too.

OK, how can you test if the result is random?

Firstly, this is a complexity problem. You can't necessarily test the system internals [aka business] as a whole if the result isn't predictable or consistent. However, what you can test, is that the unit which is the individual person, does manifest the rules correctly! i.e. they keep the same distance from their two folk at all points of change, including all points of jostling! After all, most software systems test that rules manifest correctly. For example, you can't open a bank account if you don't have ID or you can't board a plane for an international flight without a passport. Each and every one of the individual entities, as well as the whole in deterministic systems, is defined by: 

  • A pre-condition, which includes the initial state of the system - The position they are in in the room 
  • An action - Someone moves
  • A post-condition - They have to remain equidistant

With an invariant that they have picked two constant people to apply the rule with.

Which in BDD/Gherkin syntax is akin to:

Background each person has two different folk to focus on
##...

Given the person is in the room
When someone moves
Then the person has to be the same distance from their left-person and right-person

Remember, a static point is not just the structure or entity, it is also the behaviour it exhibits. Hence, the best way to make a change and make it testable, with the minimum of risk. is to nail all but one of the folk (read systems, which include the entities and how they behave – that is the aggregate of business, application, data and technology for each feature), make that small change, test they manifest the rules, then release everything, make sure the system didn't disintegrate (i.e. all the other elements correctly adhere to their own rules, which may be the old ones), then for the next change, nail all but a different one, make a change, release etc. The key is to test that the one body itself adheres to the simple rule you want of it! This provides parallels in systems?

For example, if in the static points game above, if we took just one person (which is a business unit or capability), let's call them 'delta' and made the rule that they stay an arms length away from everyone else and can pull the folk together if they are not, then played the game again. They may get jostled about a bit by the rest of the business going about its [old] business, which is still testable, whilst simultaneously pulling the two folk to their arms length distance. Note, through pulling folk, the rest of the system, that means folk who have picked one or other or even both of the people pulled by delta, and their 2nd, 3rd and nth degree of separation, will also change. So this new rule influences the system as a whole, but crucially, the rest of the system adhered to the old 'equidistance' rule, which like the new one, you can still measure individually (as mentioned at the top of this section). You measure that Delta is doing their job by ensuring they keep their two within 'punch distance' at all points of change, i.e. jostling.

Conclusion

Trust me, this is a very difficult concept for some folk to get and it requires some 'micro-thinking'. Indeed, it always provides a learning point in communication to me. Whilst there is almost nothing anybody in the IT world can tell me about non-linear system dynamics, there is a lot I have to learn about communicating the concept across in language people understand. That is why I attend community events, such as TechNights, Lean Agile Manchester etc. it’s to learn to effectively communicate the ideas to people who do not have that bridge or background. I've been through this sort of discussion a couple of dozen (or more) times and I still communicate this wrong now, because there may be levels of knowledge or skill between the person I am trying to communicate this to and the understanding of non-linear dynamics that would help illustrate the benefits of the knowledge. I'd be interested to see how others communicate this to analytical and non-analytical audiences alike.

So the best I can do for now is probably illustrate it with video. In the external links below, take a look and see if the systems look the same as each other after they've been running for a while. Indeed, you can run the YouTube vids side by side if your broadband is up to it.

External Links
n-Body Gravity Simulation like folk at the edge of a room - https://www.youtube.com/watch?v=XAlzniN6L94
n-Body simulation with 50 million entities - https://www.youtube.com/watch?v=OJaE9J39A8s

VIew these two 3 body problems side by side:
https://www.youtube.com/watch?v=VX9IdCnNWJI
http://vimeo.com/11993047 (from 24 seconds in - This also has multiple runs with different starting points)

Tuesday, 8 July 2014

Kanban in IT: Why You're Probably DOING IT Wrong!

Despite it's age, especially in other fields, Kanban is a relatively new addition to the IT world. As someone who is easily just as inquisitive about the development process and working more effectively and systemically, when Kanban was mentioned all those years ago, I looked at the history of the process, put my mathematical hat on, my searching boots on and started to try to understand these systems in more detail.

For those who are not familiar with Kanban, it originated in the manufacturing world. Specifically, it stemmed from the study of supermarket demand in the 1940s which and later became the Toyota production system (TPS) in Taiichi Ohno's seminal work from 1988. Get that? Started in the 1940's! Some 60 years before IT ever got its hands on the idea.

The method became arguably the most solid foundation in Just-In-Time manufacturing bringing unparalleled and unmatched production quality and speed to the Japanese car market. As a child of the 80s, I remember the sheer envy of the rest of the world of the Japanese market, which at the time outshone the German market for efficiency. It even caused a plethora of Hollywood films about firms being subsumed (aiming to, or avoid) by Japanese companies, such was the dominance of the Japanese car market at that point.

Additionally, whatever you think of process improvement methods, Lean-Six Sigma and Kaizen both use Kanban process as cornerstones of process improvement techniques & there are a number of mathematical and statistical studies of the technique which have also delivered some heuristics to follow. So again, old hat.

As a software development professional, I use Kanban all the time and as an agile early adopter, I have done for a good, long while. However, one thing that always crops up, which I believe is fundamentally wrong, is the notion of tickets moving across the board as the work items themselves. I often have to reiterate the ticket isn't the work item, it's a representation of the needs of the work item. A Kanban signal!

Now, in true [just after] 80s style, you can watch some videos explaining the manufacturing equivalent of the pull system:

https://www.youtube.com/watch?v=w3Ud7pEhpQM

Kanban has been used in manufacturing, healthcare, baking etc. and the only one that I admit to taking umbrage at is the software dev Kanban and here's who. Pay particular attention to how this works! A key takeaway is that information flow, the ticket which includes the 'specification' of the batch size/container, flows from right-to-left, whilst the implementation (real thing) flows from left-to-right.

Self-flagellation? 

No, I believe in being realistically critical enough about our own work to find the points for improvement. Admittedly, some folk see this as me being negative and make no mistake, there are times I am especially when trying to get some teams to think about change is like head-butting a wall over and over or swimming through treacle - There are only so many times you can keep head-butting that wall before you cease to add value. So companies without the necessary buy-in can learn the hard way when their competitors overtake them and if some staff then leave or are made redundant, they company and staff find themselves without the requisite skill-set to compete with other candidates on the market. It is a huge problem in the IT world especially and one of the reasons why some people were forced out of the industry as agile methods took over.

We also need to reframe this as learning, not criticism. Especially when considering (For those of us lucky enough to have some understanding of optimisation), a theoretically optimal system isn't guaranteed to be unique in any situation! So you can get more than one optimum so there is more than one right answer at the time. In the case of manufacturing or economic systems, this is because there are often more variables than there are equations to solve them (implicit or explicit). So this naturally becomes an optimisation problem with almost always more than one solution, but those solutions do exist and can be found through iterative methods. 

Whilst I was involved in the creation of the mathematical algorithm and ran that derivative of IPFP for the UN Development Programme's JOrdanian Social Accounting Matrix in 2012 (based on matrix-raking - it's an iterative algorithm) Kanban modelling doesn't need that level of sophistication. For a lot of problems Linear programming is a sufficient way to look at these systems. However, this is outside the scope of this article, as much as it pains me to say it :) So I'll stick with giving you top-3 tips, but assume you're already segmenting customer feature end-to-end (i.e. entire thin Lines of Business).

TOP-3 TIPS


1. Kanban is a Pull-System

CORRECT! It very definitely is a pull system! So why are you pushing cards across a board? Stop doing it! Think about how you can signal that a task is ready to be pulled. Some folk use smaller green stickers/tiny post-it notes etc. 

In my mind, and this isn't shared by everyone (but everyone has been wrong before ;), the ticket represents a container for the item you're producing (whether that is a feature of a system, with many features going into an epic container for the MMF or MVP) or a physical item, such as a container for a 'Login page'. The item is not the login page itself.

The filled container is what the customer wants. If you're Kanban process looks like the following deliberately not perfect example:

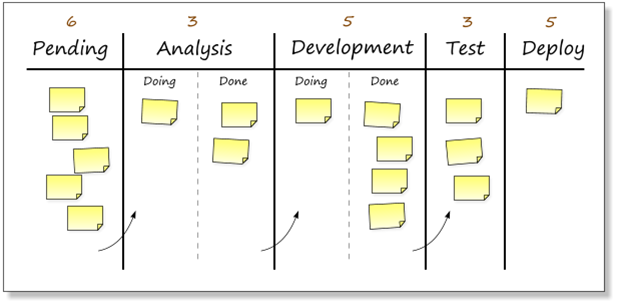
image from bob's lean learning

The arrows represent where the items go when they are pulled form the previous stage, not pushed once done. At the end of the flow, the deployed container is what the customer gets. The customer pulls this from the test stage once it's ready, which pulls this from the development stage once it's ready, which pulls this from the analysis stage once it's ready, which pulls the 'material' from the pending backlog once it's ready. The specifying pull-signal moves from right-to-left. From customer needs, which effectively specify the acceptance criteria for the system through behavioural tests (BDD/Gherkin) or even just BOLT ("As a... I want... so that...") through to picking up the raw materials (tools, projects, repos etc) at the very beginning. You'll note one crucial and perhaps controversial thing... DEVELOPMENT IS NEXT TO LAST!!!!

Before you start shouting off, this doesn't mean that developers are last, inferior or can be demeaned. After all, you're working in multi-function teams and this is a stage not your job or role right? 

Even if you are in charge of it and are feeling insulted or devalued now, ask yourself why that is? Are you protective over your role in the team? Is it Test-Driven Development you are practising? If so, what do you think that truly means? Does the customer care (or is their value measured) by the teasing out or refactoring of tasks which don't pass acceptance tests, glean feedback or deliver much needed value? No, of course not (you better agree!) because the old agile statement about the code being the final arbiter is complete rubbish and has been one that I've thought ridiculous from the start! Whether it delivers value is the true arbiter of the worth of the code and the efficacy of the team. All those feelings of anxiety that may manifest are indicators of 'threat' and dare I say, were felt by the people who were told to move to agile environments some 15 years ago at the turn of the millennium. Indeed, I myself felt them at the time and there is an important lesson in that.

Take a look at this video for 5S a lean manufacturing improvement vendor and see if you can spot some of the things which also conceptually apply to software development (SPOILER ALERT! "All of them") then think about how this can applied in your org:


Or how about this video of a an office space? I think there were more points in this for improvement (HINT: the business cards)


WATCH FOR: No visual indicators of 'ready', usually accompanied by people moving cards into the in-tray of the next stage to the right once complete. This is the same as using 'in-trays' and runs counter to Kanban. QA not being involved (or taken seriously at retrospectives).

TIP: Get small stickers or post-its to show that a task is ready to be pulled, or perhaps have a sub-column for tasks that area ready.

2. Pull-Signals Flow Right-To-Left

Information in the form of pull-signals makes its way from the right hand side of the board to the left hand side of the board. Compare this with a manufacturing plant, where different stages in the process often have differing levels of local inventory, for different parts of the whole. For example 4 screws are used to mount a single kickplate on a door which is pulled as a trolley of doors and kickplates, with the screws at the bench.

In software development a feature is a particular item of meaningful functionality. After going 'backwards' through the testing stage (which remember, is just the container/pull-signal for the work) this may get broken down into smaller architectural chunks, which may have TDD tasks wrapped around them. 

Can you see what I am suggesting here? Yes, QAs are effectively your architects. If you're a developer, then I expect there's PANIC! But again, it is TDD you're practising right?...

The truth of the matter is the market isn't currently aligned to this idea at all. Companies still value testers much less than they do development staff and as a result, most people with development skills do not move into testing roles else they earn around 17% less in salary terms, though the contract market is much better aligned. Until this changes, the motivation for better, more technical test staff will simply not be there.

WATCH FOR: Classic indicators of this are where developers run (and talk most at) the stand-ups, a developers is, say, a Scrum master or team lead, the developers drive change, look at technology choices before customer value, the retrospectives are not data driven or are otherwise poor and the team use only one type of testing process (such as TDD) with no attention to behaviour, increment size, load and/or performance testing. Whilst not exclusively the preserve of developers, it indicates both siloed thinking in job role and no strength being attributed to the test side of the team.

TIP: Encourage buy in from the team and make them aware that the QAs run the testing process. Encourage pairing for KTP and the breaking down of features led by the testers, not the development staff.

3. Business Analysts are also your Feedback!

More often than not, a business analyst is found on a team and they illicit requirements. They also look at the business process at hand and determine the value of the tasks but rarely do I see a business analyst be involved in decisions and reporting ROI and team and capability effectiveness. This is the missing link.

When working lean, the aim is to get feedback on how well the business vertical is working. A business analyst does exactly that! They have to look at the customer value of each and every story and determine the cost-benefit of doing each [thin business vertical] task. They will also help determine the Rate-Of-Return and the Return-On-Investment of a project in the customer's mind as well as look at the customer experience elements, both inside the outside the team. Together with the QA's they are crucial in determining how effective the team are, how well they are working together and determining the scope, location and exposure to any points of waste or constraints in the process. They will be skilled at determining the appropriate contextual metrics and constraints (a bank is different to a mobile social media app start-up) and monitoring the necessary measures of value.

WATCH FOR: Retrospectives without numbers or no change in waste, blockers or bug numbers in each iteration over a period of time or no predictability in flow. This is likely nearly every one you'll ever attend (and is why they're wrong). Some companies, such as Lastminute.com have moved up a level, but they are very very rare!

TIP: Get the business analyst to think about operational expenditure and how the team adds value. If you take the brave (but I think legitimate) step of align reward to profitability, then the business analyst will be crucial in determining that for the team. This will include finding the internal independent variables influencing flow, cycle-time and throughput/velocity, such as number of blockers, bugs, enhancements and other levels of waste.

Summary

Moving to lean from just plain agile is a tough ask for a lot of companies anyway, whichever field they're in. This article gives you necessary but not sufficient things to look for when walking the floor at your company. 

Note, there are better companies out there than us in other fields and we are guilty in the IT world of not being humble enough to understand that. It isn't that the problem of Kanban is any different in software or product development (at least I can't see a significant difference), just that our grasp about what a batch or container is, is very muddy. We can and do use story points, but need to attach these to features which combine into epics and hence make up MVPs and MMFs. Other techniques such as creating thin slices of functionality reduce the variance enough to introduce a reasonable element of predictability into the container or batch size. 

We also think that development is the cornerstone of the business, which any CEO will tell you, isn't true. It's an enabler, often to a product or service which pre-dates computers. If they could get something to do it as fast, but without the development overhead, they'd choose it over developing software any day, as there is much greater uncertainty in software. We already see this inside the IT space with build or buy decisions. So the role of business analyst and QA is crucial in process optimisation and it certainly isn't the preserve of the development team.

Teams inside and outside organisations need to make sure they understand that they are also part of the value chain. Your customer takes a problem, adds value in the solution they create (which includes the software they get you to write) and 'sells it on', providing a solution to their own customers, who may be Joe Public. If you've worked in B2C or B2B service companies before, this is always the case. Being in IT doesn't lose you the economic reasoning and truth be told, in capitalist environments, I think that's unforgivable if you think that's the case. 

Happy Leaning!

Sunday, 18 August 2013

Evolutionary Estimation

This is a topic that I've started but had to park numerous times, as timing has simply not been on my side when I've had it on the go. I started to think about the mathematics of Kanban a couple of years ago as I got frustrated by various companies being unable to get the continuous improvement process right and not improving their process at all. The retrospectives would often descend into a whinging shop, sometimes even driven by me when I finally got frustrated with it all.

In my mind, cycle-time and throughput are very high level aggregate value indicators which is often measured in the world of the client by a monetary sum (income or expenditure), target market size or some risk indicator. To throw out the use of analytical processes and indeed mathematics as traditional process driven 'management' concepts is fatal to agile projects, since you are removing the very tools you need to measure alignment with the value stream that underpins the definition of agile value, not to mention violate a core principle in agile software development by losing the focus on value delivery to the customer.

I won't be covering the basics of continuous improvement, that is covered by many others elsewhere. Suffice to say that it is not a new concept at all, having existed in the world of manufacturing for over 40 years, in Prince 2 since the mod-to-late 90s and process methods such as Six-sigma, maturity models such as CMMI, JIT manufacturing (TPS we all know about) etc.

In software, it is really about improving one or both of the dependent variables of cycle-time and throughput (aka velocity) and often takes place in the realms of retrospectives. I am not a fan of the flavour of the month of just gathering up and grouping cards for good-bad-change or start-stop-continue methods, as there is often no explicit view of improvement. It affords the ability to introduce 'shiny things' into the development process which are fun, but has a learning lag time which can be catastrophic as you head into a deadline as the introduction of a new technology introduces short-term risk and sensitivity into the project. If you are still within that short-term risk period, you've basically failed the project at that point of introduction, since you are unproductive with the new tool, but have not continued at full productivity on the old tool. Plus, simply put, if you want to step up to work lean, you will have to drive the retrospective with data, even if it is just tracking the throughput and cycle-times and not the factors on which it depends (blockers, bug rates, WiP limits, team structures etc.)

I have written quite a bit of stuff down over the last couple of years and so I am going to present these as a series of blogs. The first of them here covering improved estimation.

Let Me Guess...

Yes, that's the right answer! :-) Starting from the beginning, especially if like me, you work as a consultant and are often starting new teams, you will have no idea how long something is going to take. You can have a 'gut feeling' or draw on previous experience of developing similar or not so similar things, but ultimately, you have no certainty nor confidence in how long you think a task is going to take.

The mathematical treatment of Kanban in software circles is often fundamentally modelled using Little's Law, which is a lemma from the mathematical and statistical world of queuing theory. In it's basic form, it states that the average WiP items (Q) is the resulting arrival rate of items into the backlog (W. and when stable, this is also the rate at which it moves into 'Done' - aka throughput in unit time) multiplied by the average time the ticket, a story point or whatever (as long as it is consistent with the unit of throughput) spends in the pipeline, aka its cycle-time (l).

Q = lW

Little's Law can be applied to each column on the board and/or the system as a whole. However, here's the crux. The system has to be stable and have close to zero variance for Little's law apply effectively! Any error and the 'predictive strength' of the estimate, which most clients unfortunately tend to want to know, goes out of the window. After all, no project has ever failed because of the estimate, it is the variance from the estimate that kills it. Reduce the variance, you reduce the probabilistic risk of failure. A variance is simply:

V = | A - E |

Which is the absolute difference (don't care about negatives) between the actual and estimated points total or hours taken. You have some choices to reduce the variance and bring the two into line. Improve your estimates, deliver more consistently or indeed both.

However, Kanban has been modelled to follow a slightly more general model, where a safety factor is included in the equation. In manufacturing and in software, safety is very often (but not always) associated with waste. The equation basically adds a safety factor to Little's laws, thus allowing for variance in the system. So it looks more like:

Q = lW + s

Aside from many things, Kanban helps to introduce lean principles into the process and eventually, aims to reduce the safety factor, making it reliable enough to be modelled by Little's law, where the mental arithmetic is not as taxing :-)

Part of doing this in software, is reducing the need to have slack in the schedule, which in turn is dependent on the variance in the system. Getting better at reducing the variation and eventually the variance, improves the understanding, accuracy and reliability of the estimates and this is the part I'll cover today.

What's the point?

I have never really been a fan of story point for the reasons that have been given by the practising agile community. The difficulty is that unlike the use of hours, as inaccurate as they are, they don't have an intuitive counterpart in the mind of the client and are simply too abstract for developers, let alone customers, to get their head around, without delivering a corresponding traded-off benefit for that loss. Effectively, a story point also introduces another mathematical parameter. This is fine for maths bods, and I certainly have no issue with that, but there isn't actually a need to measure story points at all. Story points violate the KISS principle (or for true engineers, Occam's Razor) and inherently make the estimation and improvement process more complex again, without a corresponding increase in value apart from maybe bamboozling management. What doesn't ever come out is how bamboozled the development team also are :-)

It's no great secret that despite including the use of story points in the first edition of XP Explained, Kent Beck moved away from the use of story points and back to hours in his second edition, much to the dismay of the purists. In my mind, he simply matured and continuously improved XP to use a better practise (which has it's roots in a previous practise) and so personally lives the XP method. He gained a lot of respect from me for doing that. That said, points aren't 'point-less' but if you wish to use points, you need to get to the... erm... point of having some form of consistency in your results... OK, I'll stop the puns :-)

For those experienced in the lean start-up method, there is a potential solution to the metrics which removes some of the unknowns. Following on from the above discussion around variance, consider one of the team's Kanban metrics to be measurable by the width of the standard deviation. The metric would be to repoint/reestimate tasks based upon the validated knowledge of what you find from the continual experiments with the estimation->adjustment cycle, until you achieve normally distributed (or t-distributed if the number of data points is below about 25) 1-point, 2-point, 3-point, 5-point,... data. That will then allow you some leeway before then evolving to make the distribution as narrow as possible.

For example, the A/B-test for the devs would be to set the hypothesis that taking some action on estimation, such as re-estimating some tasks higher and lower, given what they have learned about somewhat similar delivered stories will yield a narrower variance, hence a better flow, reduce risk and improve consistency (especially to the point where the variance from Little's law becomes acceptably small). This would take place in the retro for each iteration, driven by the data in the process.

In the spirit of closing a gap a conversation and hence improving the quality of that conversation, for a product owner, manager or someone versed in methods such as PRINCE 2, PERT, Six-sigma, Lean or Kaizen, this will be very familiar territory and is the way a lot of them would understand risk (which in their world, has a very definite value, most obviously where there is a financial consequence to breaching a risk threshold). As time goes on, you can incorporate factor analysis into the process to determine what factors in the process actually influence the aggregate metrics of throughput and cycle time.

Show me the money!...

No, because it varies on a number of factors, not least the salaries of the employees. To keep the discussion simple, I'll attach this to time. You can then map that to the salaries of the employees at your company and decide what the genuine costs and savings would me.

Imagine the following data after some sprints. This is fabricated point data from 2 sprints, but is still very typical of what I see in many organisations.

table 1 - initial 2 x 4-week sprints/iterations worth of data 

From this you see next to nothing. Nothing stands out. However, let's do some basic analysis on it. There are two key stages to this and they are:

  1. Determine the desired 'shape' of the distribution from the mean and standard deviation in the current data
  2. Map this to the actual distribution of the data, which you will see is often very different - This will give you an indication of what to do to move towards a consistent process.
You'll note that I deliberately emphasised the word 'current'. As with any statistic, it's power doesn't come from predictability per se, it comes from it's descriptive strength. In order to describe anything, it has to have already happened. Lean Start-up takes full advantage of this by developing statistical metrics without using the term, as it may scare some people :-)

So, from the above data we can see that we have more than 25 data point, so we can use the normal distribution to determine the shape of the distribution we would like to get to. The following graph shows an amalgamation of the normal distribution of time taken for each 1 to 8 pointed ticket up to the last sprint in the data set (if you work on the premise that 13 points is too big and should be broken down, then you don't need to go much further than 8 points, but that threshold depends on your project, team, and of course, how long things actually take). The overlaps are important, but I will come back to why, later.

fig 1 - Points distribution in iteration 1

Having got this, we then plot the actual distribution of the data and see how well it matches our normals.

IMPORTANT ASIDE
As well as showing that the overlap of the normals mean that a task of 4 days could have been a one point of an 8 point task, causing unpredictability, for the points themselves the distribution above also shows a very interesting phenomenon and that is the informal ratio of the height against width of each peak. The distributions may well even have the same number of data point (you get that by integrating the areas under the distributions or of course, using normal distribution tables or cumulative normal functions in Excel), but the ratio intuitively gives you a sense of the variance of the estimation. The narrower the better and it shows our ability to estimate smaller things better than larger things.

I often illustrate this by drawing two lines. One small (close to 2cm) and one much larger (close to 12cm) and ask someone to estimate the lengths of the lines. The vast majority majority of people come within 10% of the actual length of the small line and 25 - 30% of the bigger line. It's rare that estimations are the same for both sizes. This is why taking on smaller jobs and estimating them also works to reduce risk, because you reduce the likelihood of variance in the number of points you deliver. Smaller and smaller chunks.


Anyway, back to the distributions. Using the original table, do the following look anything like normal?

fig 2 - Actual distributions

If you said yes, then..., ponder the difference in weight between a kilogramme of feathers and a kilogramme of bricks.

OK, I'm being a bit harsh. In some of the distributions we're almost there. It's easier to see the differences when you take into account the outliers and in these distributions, it is pretty obvious when you consider the kurtosis ('spikiness') of the corresponding curves. Kurtosis is the spikiness of the corresponding curves (approximating these discrete distributions) against the normal distribution for that data. It's easier to see this on a plot, again using Excel.

fig 3 - first generation estimates

As expected, we're pretty close with the 1 point stories, partly because of the reasons mentioned in the previous aside. The 2, 5 and 8 point estimations, whilst quite unpredictable show something very interesting. The kurtosis/spikiness in the curves are the result of peaks on either side of the mean. These are outliers relative to the main distribution. These are what should be targeted to move into other point categories. The 4, 5 and 6 day tasks which resulted from the 5-point estimates are actually more likely to be 3 point tasks (read the frequencies on the days in each graph). The same is true for the 1, 2 and 3-day, 2-point tasks as these are much more likely to be 1 point tasks. This is also the case when looking for data to push to higher points. 

What are you getting at?

Estimation is a process we get better at. We as human beings learn and one of the things we need to do is learn the right things, otherwise as we search for cognitive consonance to make sense of any dissonance we experience, we may settle on an intuitive understanding, or something that 'feels right' which may be totally unrelated to where right actually is, or a positions which is somewhat suboptimal. In everyday life, this leads to things like superstition. Not all such thoughts is incorrect, but in all cases, we need to validate those experiences, akin to how hypotheses are validated in lean start-up.

In this case, when we push the right items, the right way, we then get a truly relative measure of the size of tasks. At the moment, if we are asked "how big a task is a 2 point task?" we can only answer "It might be one day, or it might be 8 days, or anything in between". Apart from being rubbish, it has the bigger problem that if we are charging by point, we have no certainty in how much we are going to make or lose. As a business, this is something that's very important to know and we need to get better at. For those who work as permanent staff, have a salary for the predictability and surety and a business is no different.

The statistical  way to assess how good we have become at estimating is to use goodness of fit indicators. These are particularly useful in hypothesis testing (again very applicable to Lean Start-up again). The most famous being the r-squared test, most often used for linear regression, but can be used for normal distributions and also the chi-squared tests, which can be applied to determine if the distributions are normal. We can go further by using any L-norm we want. For those that have have worked with approximation theory, this is fairly standard stuff, though I appreciate it isn't for everyone and is a step further than I will go to here. The crux is better our estimates and actuals fit, the better the estimating accuracy and the better the certainty.

OK, I push the items out, what now?

Cool, so we're back on track. You can choose how you wish to change point values, but what I often do is start from the smallest point results and push these lower outliers to lower point totals, doing this for increasing sized tickets, then starting from the high valued tickets and working backwards, push the upper outliers on to higher valued tickets.

All this gives you a framework to estimate the immediate-future work (and no more) based on what we now collectively know of these past ticket estimates and actuals. So in this data, if we had a 2 point task that took 1-day, it's likelihood is actually that it is a 1-point task, given the outlier. So we start to estimate those tasks as one point tasks. The same applies to the 6 and 7-day 2-point tasks as they are most likely 3-point tasks. If you are not sure, then just push it to the next point band, as if it's bigger it will shift out again to the next band along in the next iteration or if it is smaller, as we get better at estimating, it may come back.

Assuming we get a similar distribution of tasks, we can draw up the graphs using the same process and we get graphs looking like:

fig 4 - Second generation estimates, brought about by better estimations decided at retros.

As we can see, things are getting much smoother and closer to the normal we need. However, it is also important to note that the distribution of the old expected from the now actual has shifted and so has the normalised variance and mean of the distributions themselves (i.e. the normal distribution curves in blue have themselves shifted). This is easier to illustrate by looking at the combined normals again. So compare the following to figure 1.

fig 5 - Second generation normally distributed data

So our normals are spacing out. Cool. Ultimately, what we want it to rid ourselves of the overlap as well as get normally distributed data. This is exactly the automatic shift in estimation accuracy we are looking for and is touted by so many agile practitioners, but is never realised in practise. The lack of improvement happens because retrospectives are almost never conducted or driven by quality data. It is the step that takes a team from agile to lean, but our validated knowledge on our estimates, together with the data to target estimation changes (which is the bit all retrospectives I have ever been to when I have started at a company, miss out) is missing. As we can see here, it allows us to adjust our expectation (hypothesis) to match what we now know which in turn adjusts the delivery certainty.

OK, fluke!...

Nope. Check out generation 3. This also illustrates what to do when you simply run out of samples in particular points.

fig 6 - Iteration 3, all data. Note, 2-points and 5-point values

The interesting thing with this 3rd generation data is that it shows nothing in the 2-point list. Now, for the intuitivists that start shouting "That's so rubbish!! We get lots of 2-point tasks", I must remind you that the feathers and bricks are not important when asking about the weight of a kilogramme of each. Go back here... and think about what it means.

All this means is that you never had any truly relative 2-point tickets before. Your 2-point ticket is just where the three point ticket is, your 3 is your 5, 5 is your 8 and 8 is your 13. It's the evolutionary equivalent of the "rename your smelly method call" clean code jobby.

Note the state of the 5 point ticket. Give it's a value on it's own, but is covered by other story amounts, it's basically a free standing 'outlier' (for want of a better term).

Iteration 4

After the recalibration and rename of the points (I've also pulled in the 13-point values as the new 8-point tickets). We deal with the outlying 5-point deliveries (which are now categorised as three point tickets)  by shifting it to the 5-point class in the normal way. This means the data now looks like:

fig 7 - 4th generation estimation. Note empty 3-point categories.

Iteration 6

Skipping a couple of iterations:

fig 8 - 6th generation estimates.

By iteration 6, we're pretty sure we can identify the likely mean positions of 1, 2, 3, 5 and 8-point tickets at 2.72, 5.43, 6.58, 9.30 and 13 days respectively. The estimates are also looking very good. The following table puts it more formally, but using the r-squared test to show how closely the distributions now match. 'Before' is after iteration 1, and 'After' is after iteration 6. The closer the number is to 1, the better the fit. As expected, the 1-point tasks didn't improve massively, but the higher pointed tasks shifted into position a lot more and provided greater estimation accuracy.

table 2 - Goodness of fit r-squared measure

So when do we stop?

Technically, never! Lean, ToC and six-sigma all believe in the existence of improvements that can be made (for those familiar with ToC, it changes the position of constraints in a system). Plus, teams change (split, merge or grow) and this can change the quality of the estimations each time, especially with new people who don't know the process. However, if the team and work remains static (ha! A likely story! Agile remember), you can change focus when the difference between the expected and actual estimates reduces past an acceptable threshold. This threshold can be determined by the r-squared test used above, as part of a bigger ANOVA operation. Once it has dropped below a significance threshold, then there is a good chance that the changes you are seeing are due to nothing more than a fluke, as opposed to anything you do deliberately, so you hit the diminishing return a la the Pareto principle.

Conclusion

I've introduced a method of evolving estimates that has taken us from being quite far out in estimation to much closer to where we expect to be. As 'complicated' as some people may find this, we've gotten pretty close to differentiated normals in each case. Indeed now, all tickets are looking pretty good. We can see this in the r-squared tests above. Having completed the variational optimisation, you can then turn your attention to making the variance smaller, so the system as a whole gets closer to the average estimate. If you're still in the corner, it's home time, but don't forget to do your homework.

Future Evolutions: Evolving Better Estimates (aka Guesses)

Ironically, it was only last week I was in conversation with someone about something else, and this next idea occurred to me.

What I normally do is keep track of the estimates per sprint and the variance from those estimations and develop a distribution which more often than not tends to normal. As a result, the standard deviation becomes the square root of the usual sum of the residual differences. As time goes on in a Kanban process, the aim is to reduce the variance (and thus standard deviation by proxy) and hence increase the predictability of the system such that Little's law can then take over and you can play to it's strengths with a good degree of certainty, especially when identifying how long the effort of a 'point' actually takes to deliver. This has served me pretty well either in story point form or man-hours.

However, after yesterday's discussion, it set me thinking about a different way to model it and that is using Bayesian Statistics. They are sometimes used in the big data and AI world as a means to evolve better Heuristics and facilitate machine learning. This is for another day though, you've got plenty to digest now :-)

Saturday, 9 February 2013

Agile software development under TOGAF

Phases G & H: the Architecture Governance Iteration

In a blog post last year, I covered how Agile and TOGAF are perfectly compatible and outlined the similarities that they have.

The title of the post won't resonate much with agilists out there, as the term 'governance' is something that most think of as 'management bureaucracy'. However, the truth of the matter is that if you look at Kent Beck's seminal work on XP and consider the principles and practises section, you'll see that these are in effect, principles and governance guidelines.What I mean by this is probably best illustrated via an example.

Imagine you are an agile QA. In order to adjudge whether or not a piece of software has been developed solidly, agile QA's often carry out the role of checking code coverage and complexity measures and monitor that coverage against metrics defined in their testing strategy. This can be automated and they instantly see a governance measure that they can check against what are effectively their organisational unit's (software development department, say) principles of TDD/BDD etc.

For software developers and architects out there, remember, TOGAF is a much broader and more abstract framework to develop enterprises under (I steer clear of just applying it to software, since it isn't technically a software development methodology. It is an EA framework, or systems development methodology if you look at it through those particular eyes). It covers business architecture, data architecture and technical architecture as well as application architecture and at the highest level, it does this without recourse to any technological concepts at all in those stages (so there are no explicit, detailed references to Visual Studio 2012, SQL Server 2012, MySql, PHP etc.). The aim is to consider the organisation as a whole as a system.

Statics and Dynamics

Any system, in whatever form, only require two high-level concepts to fully define it's operation. These are:

  • Statics - which in the case of business are things like the structures, entities, artefacts, roles, people, systems etc. etc. 
  • Dynamics - How these static elements interact and indeed how the organisation as a whole behaves.
In the world of software, we have seem this many times. For example, the GoF books were split into patterns of structure and those of behaviour and we also have languages to express those interactions, such as UML class and collaboration diagrams. These days, systems thinking is finally making inroads into the software world, despite those of us already familiar with the concepts having used it for nearly 15 years (some of you out there will have used it longer than I have).

Just like businesses as a whole, you have different levels of abstraction which define the organisation. You can define the system dynamics at varying levels of details and just like you have, say, different levels of UML diagram (use-cases to compartmentalise the operation of a software unit, with activity diagrams which define the functions within it. In themselves, these functions can be another use case diagram's use case, in the case of say, a component or package), the same is true of business. BPMN's ability to run sub tasks is another example of this. However, I don't want to get hung up on the language of expressing a business, as this is different from the business itself.

fig 1 - TOGAF ADM with different sub iterations (from Mike Walker's blog on MSDN, copyright The Open Group)
And just like a business, TOGAF allows different levels of EA for each level of the architecture partition or indeed organisational unit.

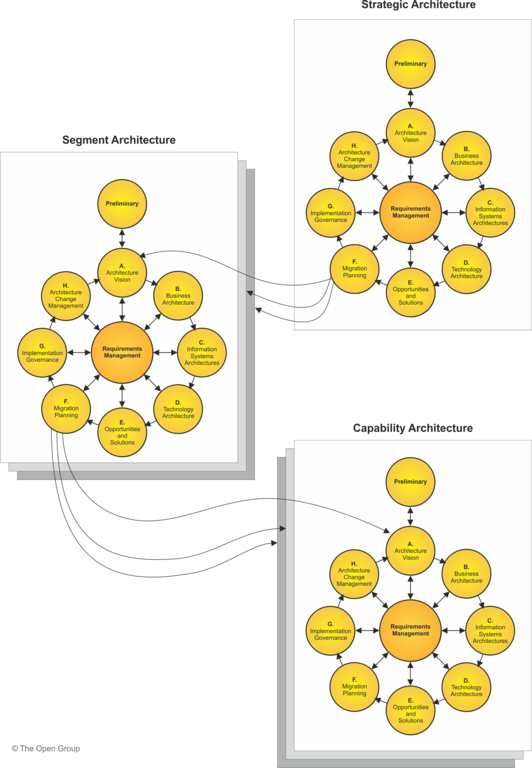
fig 2 - TOGAF ADM applied at different levels of partitioned architecture (copyright The Open Group)

How does this fit?

Well, a business is a system. Software is a system. Software development is a system. Everything in this context is just a system. Apologies to people who really hold on to the psychological element of agile methods, but you are being kept a happy cog in a big wheel :-) This is not to say it shouldn't happen, but you are there to develop software at the end of the day. Indeed, remember, you and your team use elements like Kanban to 'manufacture' software just like a they do in a factory.

AGILIST: "OK, stop flaming us! Really, how does it fit?"

Joking aside, during a software development project, you will often use BDD/TDD to develop acceptance criteria and the amount of coverage in these scenarios is your governance metric. Additionally, some agile teams are aware of risks and issues that they have to monitor. They also use metrics to define 'productivity' such as throughput and cycle time They also run retrospectives to continuously improve. Software dev peeps should pay particular attention to phase G in TOGAF gives you all that when defining a system representing your organisation. Software, Business, Data and Tech Architects may be involved in earlier phases, maybe even A to E, depending on the model of TOGAF used at each level of architecture partition. But for devs, phase G of  the ADM gives you:
  • Project name, description and objectives [Project name/Description/Epics]
  • Scope, deliverables and constraints
  • Efficacy metrics [Throughput/Cycle time/Business Value]
  • Acceptance criteria [BDD]
  • Risks and issues [Risk Log]
I have linked the Agile concepts in square brackets. As you can see, we have everything required for the initiation of an agile development project right there. 

Remember, when going through an iterative enterprise architecture process such as TOGAF, there is no BDUF exercise. Each transition goes through an iteration of the ADM, which creates an incremental change to the organisational system as a whole. Within each iteration, at phase B, businesses are architected or rearchitected and IT systems are developed to facilitate that business operation. Same as always. 

Some developers see themselves as coming into play quite late in the process (Phases G and H - last n the cycle). It seems to them that there is a BDUF exercise going on, but really the business is defining itself at the beginning of the cycle. After all, you can't have acceptance criteria defined by the business if there is no business :-)

By contrast, when you get a BDD spec for an existing, well understood business, the business system (with it's statics and dynamics) is already defined for the business owners. They have lived it and worked it for years. The business owner knows what they want and work with the 'three headed monster' (BA, QA, dev) to spec that out in Gherkin for example. In this case, there is no need to reengineer the business to then submit acceptance criteria to the devs. In TOGAF, it is exactly like going through the Architecture Definition Iteration (cycles of ADM phases B to F) with the existing formal baselines already in place, but having no EA change requirement. So you can get through those in very little time and go straight to phase G, which is where these BDD criteria form the acceptance criteria for the IT systems (I appreciate using TOGAF here is overkill, but the point is about illustrating the pattern).

Remember this...

Whilst TOGAF is an EA framework and, say, SCRUM is an Agile software development practise, they both work to define systems. Both are iterative and incremental in nature. They just work at different levels and to some degree, can have very different cycle times. After all, TOGAF would also concern itself with the definition of an organisation's services, people required to carry out enterprise functions within that service, the information (not 'data') they require to do their job, and provide services which may or may not use IT at all (think shop assistants, call centre operatives, cleaners, warehouse staff etc. etc.) and their roles have to be at least understood if not engineered into the business system as a whole. This is something IT personnel take for granted when defining software. Even in RUP they assume actors already exist, but I would say how do they think those actors came to exist? TOGAf is a way of making that happen.