Showing posts with label statistics. Show all posts

Thursday, 10 September 2015

Lean Enterprise

I attended the Lean Enterprise session last night at ThoughtWorks Manchester. Speaking were Bary O'Reilly and Joanne Molesky, who coauthored the upcoming Lean Enterprise book with Jez Humble.

I happen to like Barry O'Reilly's work. As a lean practitioner, I don't think I've ever disagreed with anything he's said (at least, not to any significant degree - believe me, I try :). Whilst I came into the venue and fumbled my way to a seating position with folded pizza slices in hand, they had just started speaking (thank you Manchester City Centre for having so many roadworks going on at the same time that I had to U-turn on myself 3 times to get in).

I am always interested in looking at how companies close the feedback loop. i.e. how they learn from the work they've done. Not just learn technologically, but also about their process, about themselves, their culture and how they work. I'm a great advocate of data driving retrospectives. Hence, I always find myself wanting CFDs, bug and blocker numbers and a generally greater understanding of how we're developing in a particular direction.

With this in mind, I asked a question about the hypothesis driven stories (which are a really great idea that Barry has shared with the community before). The format of the story is akin to:

" We believe that <doing this action>
  Will result in <this thing happening>
  Which benefits us <By this amount>"

What I asked was around how he gets people to come up with that measurable number. There's always a nervousness in the community when I ask about this sort of thing. I don't mean to cause it, it just happens :)

Why asked it?

When working in build-measure-learn environments, including those in lean environments, the learning process aims to become more scientific about change. If the result is positive, that's fine, since every organisation wishes positive change. However, if it's negative, that's also fine, since you've learned your context doesn't suit that idea. Spending a little money to learn a negative result is just as valuable, since you didn't spend a fortune on it. The only real waste when learning is spending money on inconclusive results. Hence, if you design an experiment which is likely to yield and inconclusive result, then you are designing to spend money generating waste.

What's inconclusive?

For those who use TDD, you might be familiar with this term. If you run unit tests, you might see the odd yellow dot when the test doesn't have an assertion (async JS programmers who use mocha may see it go green, oddly). This is a useful analogy, but not wholly correct. It isn't just that you're not measuring anything, which is bad enough, since most companies don't measure enough of the right stuff (hence, most of the results of expenditure are inconclusive in that regard), it's also concluding an improvement or failure under the necessary significance threshold.

Say what? Significance Threshold?!

The significance threshold is the point at which the probability of false results, the false positive or false negative is negligibly small and you can accept your hypothesis as proven for that scenario. Statisticians in frequentist environments, those which work off discrete samples (these map to tickets on a board tickets), are very familiar with this toolkit, but the vast majority of folk in IT and indeed, businesses aren't, sadly. This causes some concern, since money is often spent and worse, acted on (spending more money), when the results are inconclusive, there is not just no uplift. Sometimes it crashes royally!

Here's an example I've used previously. Imaging if you have 10 coins and flip them all. Each fli i a data point. What is the probability of heads or tails? Each one is 50%, but the probability of getting a certain number of heads is normally distributed. This may perhaps be counter-intuitive to folk:


So you can be quite comfortable that you're going to get 5 heads in any ten flips with any ten fair coins. However, if you look at zero heads or all heads after all the flips, the outliers, these are not very likely. Indeed, if you get your first head, the probability of getting zero heads in 10 after the remaining 9 have been flipped as well is obviously zero (since you already have one).

Now let's suppose we run the experiment again with the same number of coins. An A/A-test if you like. Let's suppose we get 4 heads. Is that significantly different? Not really, no. Indeed, many good researchers would consider a significant difference to fall at either 0 or 10 in the above before they call a change significant. Indeed, an unfair coin, one which has only a head or a tail on both sides will give you exactly that outlier (all tails or all heads). Anything before this is regarded as an insignificant change. Something that you already have knowledge for or can be explained by the existing context, not the new one the team delivers, or 'noise'.

Why is this important in lean enterprises?

In business, you spend money to get value. It's as simple as that. The biggest bang for your buck if you will. Positive and negative results, those that yield information, are worth paying for. Your team will be paid for 2 weeks to deliver knowledge. If there are 5 people in the team, each paid for two weeks at £52,000 a year each (gross, including PAYE, employers NIC, pension, holidays, benefits etc.) that is £10,000.

If the team comes out with knowledge that improves the business value by 3% and the required significance level is a 7% uplift, this value addition is insignificant. Rolling this out across the whole enterprise will cost you significant amounts of money, for a result which would likely happen anyway if you left the enterprise alone. At the end, you'll be down. Lots of consultancies which have delivered positive results have actually seen this sadly. However, as Joanne rightly said in the meetup, it's often just as easy to do the opposite, and miss opportunities because you didn't understand the data. The false negative.

Teams have to be aware of that level of significance. That depends very much on sample size. You need to get a big enough sample for the 'thing' you're trying to improve. Significance levels also generally depend on that the degrees of freedom (how many possible categories each sample can fall into - heads or tails) and the probability of false positives and negatives.

If you have a pot of £1 million, each costing £10,000 you can run 100 experiments. You need them to be conclusive. So select your hypothetical number for acceptable value, the threshold beyond which a credible change can be deemed to have occurred, before you spend the money running the experiment.

Otherwise you won't likely just lose the money to gain zero knowledge (pressure to declare a result conclusive which isn't, is just another form of the sunk cost fallacy), you may end up spending more money on a result that isn't credible and it will most likely bomb (check out Bayesian stats for why), or also miss opportunities for growth adding value or something else. As a result, I'd argue that you need to know the hypothetical sample size requirement (there are tools out there to do that), but also remember to stop when you reach that sample size, not before (since you'll destroy the credibility of the experiment) and not too long after (since you're getting no significant increase in extra knowledge, but you are still spending money).

Keep it lean, keep it balanced! :)


E

Saturday, 22 August 2015

...And the battle rages on?

It's 8am here in the UK and I am still simmering over a twitter storm from about 3am my time. I made the mistake of looking at my phone after going to the bathroom (I washed my hands) and noticed more on the #NoEstimates conversation.

It all centred around the heated discussion the other day on #NoEstimates, except this time it got personal, with a few members of the discussion choosing to do the tabloid headline thing of taking one part of some of my material out of context and then basically making libellous inferences. I don't mind a heated debate at all, as long as it stays fair, but I was somewhat disgusted with the actions of a few folk, especially since they purport to work with probability and statistics, which folk who know me well, know is exactly my area of specialism in this domain. If you want to read the full article on my LinkedIn blog post and see how it's out of context, it's here, as opposed to reading the tabloid rubbish. They obviously TLDR or were out for the vendetta as opposed to admit where they were wrong. Too much riding on it I guess.

Needless to say, twitter is a really poor forum for these sorts of discussion (which is pretty much the only thing me and @WoodyZuill agree on). So I figured I'd explain it here, in a bit more detail, then post it back, as those folk are hell bent on not admitting their lack of understanding and fighting with people on 'their side' of the debate and to do that, needs a lot more than 140 characters to explain the gaps. However, before we get into how they fit within the discussion of estimates, we need to bridge some gaps and answer some criticisms.

Buzzwords

Now, I hate 'buzzwords' as much as the next guy. However, we in IT are probably more guilty of creating and using them than any other industry. Indeed, particular communities of practise create buzzwords that only those in those communities understand. Therefore it is a kind of 'private joke'. However, here's the rub, you can't get away from it. They are always necessary to succinctly communicate a concept. 'eXtreme programming', 'design patterns', 'TDD', 'Refactor' they are all examples of words used to communicate concepts in our domain. They mean nothing outside it to anyone not connected to it. So those people see it as a 'buzzword'. Is that their problem or ours?

Similarly, because we in software development are often in no way connected to accountancy and finance, when see words like 'NPV', 'IRR', 'ROR' we in the main don't get an illustration of the concepts in our minds. Hence, we see them as buzzwords. Their problem or ours?

The moment of violent agreement

So, hopefully we should now be on the same page around 'buzzwords'. Cool?

No? Do we not like hearing that?

Grow up!

Estimates (or None)

When working in an organisation, you're always going to have to justify your work's existence (sometimes even your salary/fee). It's how businesses work. Why are we doing this project? What is the business case? How much is it going to cost? What benefit am I getting out of it? The answers to all these questions are all estimates. Yes, we hate them because we are often held to them. However, being held to them is a people problem, not a problem with estimates. Business are held to estimates all the time!

Estimate Risk

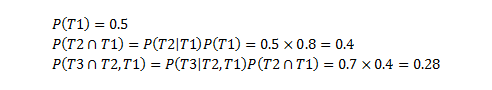
Estimates are naturally probabilistic. What is worse is that the further out you look, more uncertain that probability becomes. To expand on a previous post from the past, using insignificant data volume as an example, if you imaging you have to deliver one small task and you estimate it to take 2 days and it takes 3 days, you have one data point, with one variation of 1-day (or 50% of it's expected duration - average absolute variation of 1-day). If you then get another task and you estimate it to be the same size and it takes 1-day, then you have a range of total variation of   -1 day (delivered early) to +1 day (delivered late) which is 2 days in total. You can't make a decision on one data point.

The average absolute deviation, which is is the average across the two, is 2/2 = 1-day. That's just standard statistics. Nothing special there. You can relate that to standard deviation really easily (sum of the residual differences) and this comes out as the square root of 2, since the mean of 3 days and 1 day is 2 and the variance is 2-days. Standard deviation is the square root of variance, ergo...

Now, let's suppose you classically estimate ten such elements (deliberately staying away from 'story' as to me, a story is an end-to-end, stand alone piece, so shouldn't have a classical dependency per se) in a dependency chain on a critical path and you don't improve your process to attain consistency, the total absolute variation goes from all of the tasks being delivered early, to all of them being delivered late. From the mean (2 x 10 = 20), this becomes a range of -10-days (1 day early for each task) to +10-days (1 day late for each task) a total absolute deviation for the whole project of 20-days on a 20-day expectation, even though the individual tasks still have an average total deviation of 1-day! 

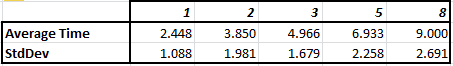
Let's now imagine we're actually delivered stuff and look at the variation of the tasks remaining after these first 2 tasks on the board have been delivered and their variation was as stated previously. Those are now not uncertain. They have been delivered. There is no future uncertainty about those tasks and of course, no need to further estimate them. The only variation now exists for the remaining 8 tasks on the board. Again, 1-day average absolute variation, means the 8 tasks remaining now have a total systemic (i.e. whole project) variation of -8 to +8 days (16-days). So you can see the variation reduce as you deliver stuff. 

It's reduction makes that darn cone to look like it does! Since you're now 4 days into the project. You can plot that on a graph.The first point of uncertainty was +10 and -10 on day zero. 4 days in, this has reduces to +8 and -8. You keep going across the time on the x-axis as you deliver stuff and you always get it finishing on a final point. After all, once you have delivered everything, you have no more variation to contend with. Zero, zilch, nada!

example of a cone of uncertainty (src. wikipedia)

There is no getting away from this fact. It's as much of a fact as the law of gravity. To do anything that goes against it without understanding it, is like this. Which whilst fun and harmless (some might consider 'pioneering'), killed people when flight was first invented and in any case, spends money pointlessly, which is waste. We are in a position where we know better, why reinvent the wheel?

What does this have to do with Estimates?

Right, here is where we get back to the meat of the matter. 'How do estimates help me deliver better software'. 

In short, as far as software development alone is concerned, it doesn't. However, and this is the bit that ired me because people just didn't seem to want to hear it, software development by itself, is useless. We use software to solve problems. Without the problem, there is no need for software (indeed, there is no need for any solution). However, don't forget organisations themselves solve client problems and those clients themselves solve problems potentially for other clients! So software development doesn't exist in isolation. If you think it does, then you exist in the very silo mentality that you purport to want to break down. Do you not see the hypocrisy in this? I am sure many of the business readers do!

Again, grow up!

Teams Should Aim to use the closeness of their estimate and actual delivery performance as an informal internal indicator of the level of understanding of the codebase and their performance with it. No more. Businesses should not use the estimate to hold the team to account as there is a high level of variance around any numbers and the bigger the system being built, especially if it has a number of components in a chain, the worse the variance will be.

Improving?

The way to improve on estimates totally depends on the way the team itself works. Let's assume the team carried out retrospectives. This is their chance to employ practises to improve the way they work, quality of the work and/or pace at which they develop software. As a rule, the team can't go faster than it can go, but the quality of the code and the alignment of the team naturally affects the flow of tasks carried through to 'done' (production, live, whatever). 

Blockers and bugs naturally affect the flow of work through the team. Reducing them, improves the flow of work, as contention for the 'story time' of the team, which is a constrained resource, then isn't there. If you don't track bugs/blockers, then you are likely losing time (and money, if you're not working for free) as well as losing out on opportunity costs or potential income (probabilistic) in value for the business be delaying deployment into done and you'll have no idea if that applies or not. If it does, the business is getting hit on two fronts. 
  1. Delivering value later because you are fixing bugs in earlier processes
  2. Costing more money to deliver a feature because you are using 'story time' to fix bugs in earlier releases
The combination of the effects of the first and the second hits your NPV and hence, directly affects your IRR and also ROR and ROI (buzzword alert). However, most developers are too far away from finance to understand this and many who purport to understand it, don't.

How can methods like Kanban and ToC help?

OK, so it's no secret the IT world, the one I inhabit, has an extremely poor understanding of flow and indeed, does kanban 'wrong' relative to the real way lean happens in manufacturing and TPS. Kanban ultimately aims to optimise flow of X. Flow of stories, tickets, manufacturing items, cars, whatever.

My scribbles on importance of understanding variance from previous posts

The process is stochastic in nature, so there is no certainty around it but what most folk don't understand is that kanban inherently has naturally got waste in the process. Movement of items is one of the recognized 7 types of Muda waste

- Unnecessary transport and handling of goods
- Unnecessary motion of employees

Transportation of goods (read stories) is a movement of one item from one stage, to another. Often a development context to a QA one or into live. There is a change of 'mental model' at that point, from one mindset, say, development, to another, say QA. That is a form of context switch, just not using time, which shouldn't be new (after all, context switching happens with stack frames on CPUs when multi-threading - Take out and store the stack frame for one thread, introduce the frame of another) and just like all context switching, it never costs nothing to do.

In addition, as per ToC (buzzword alert), there is inventory, and indeed, a 'wait time' between stages where the item is ready to be pulled on demand can be considered an implied 'inventory' stage. This introduces another cost. Usually in not delivering the software into a production environment so it starts to yield knowledge or indeed, it's value.

Run a dojo and try this. Take one developer and make them code and QA one scenario. Time how long it takes to deploy that one thing into a production environment. Then take another developer and a tester and make them code one scenario and then QA that one scenarios in sequence. Time how long it takes. You'll never get faster with the QA and the dev. The cost to switch the task naturally elongates the cycle-time of the software delivery of that one task. If you did 10 tasks like this in an iteration, all sequential and the dev didn't pick up another one until the QA signed it off for live, then the throughput would be just 10 x the cycle time.

In short, introducing a kanban stage has introduced waste! You'd lose time/money as a business.

What's the benefit for this cost?  What's the trade-off?

To answer @PeterKretzman's retort

Still think so now it's been explained?

The systemic trade-off is pipelining tasks to make team delivery faster ( to be delivered by the team). Each stage can pick up a 'ready' task from the previous stage when they've finished their main involvement in their stage/phase of the story's flow through the pipeline.

Run the same experiment with 10 scenarios and this time the dev can pick up a task whilst the QA is testing the previous one. Suddenly this makes much more sense and your throughput, whilst still related to cycle-time, is not wholly dependent on it. So you are delivering the 10 scenarios much faster than you would do if it was sequential. After all CPUs use pipelining as a standard optimisation mechanism. This is obviously why we do what we do in the way that we do it in software, lean manufacturing, lean construction or anything else.

Can you get too small?

As I demonstrated in a talk I gave last year, the short answer is yes. If you keep adding columns to the point it doesn't add value i.e. isn't a step in the value chain (buzzword alert) then all you are introducing is the cost of the context switch out of that stage, with no value add, which then costs both time and money. Indeed, if you can run tasks wholly in parallel pipelines, it's much faster than kanban, but requires resources to be allocated accordingly.

To see this in the previous example, introduce a post-QA stage called 'stage' and all they do is sign a pieces of paper and then run a manual deployment. There is no value add in that process, since there are no other contentions for the 'stage' process in the organisation as it is at that moment in time. However, you're paying a post-QA personnel member money to stage it.


Conclusion

I hope folk can now see where I am coming from. However, make no mistake, I am extremely disappointed in the quality of understanding around this, the hypocrisy that exists in the field and the low down, dirty tabloid style tricks that some folk will stoop to just because they've never come across such a scenario, and as if they know it all from all organisations everywhere. The #NoEstimates movement is sadly littered with such folk who frankly seem to show a distinct lack of understanding of anything related to the field. Many show a distinct unwillingness to engage, inherently overly political standpoints to avoid having to admit a failing, limited success or understanding. After all, the only people who'd want to sell #NoEstimates if it doesn't mean anything are the #NoEstimates movement. It's a real shame as it's something I think needs to be discussed with a wider audience and as I have said previously, it has massive potential, but is being taken down a black hole with pointless discussion and constant justification across the board.

After all, if we can't constantly be responsibly critical of our field, our means of operation, then we can never ever improve what we do?


E

Sunday, 19 April 2015

Lowering Chances, Mitigating Risks or Both?

I was talking at Lean-Agile Manchester this week. It was a choc-full event which necessitated the adoption of extra chairs.

A number of the XP Manchester folk were in, which is always entertaining, since the two groups have overlapping common interests but as with many agile vs lean schools, we don't necessarily come to an agreement on the best way forward for things.

There were some great questions through the night! Including the ones form the hecklers. It centred around data from some graphs I showed from a previous blog post tried not to go into the maths of due to the typical spread of the audience. So I offered to take it offline so as not to bore the audience, but there wasn't the appetite form the questioner, so smackdown happened and they then agreed to take it offline but never got back to me, darn it! (#invitestillopen)

Background

What's the reason for the graphs?

Several years ago, I was working in a company which was on the proverbial agile journey. They were still thinking in very big-design ways and were managing programmes of work through standard programme and project management methods. The company's attempt to have conversations around agile programming were not really working and the second attempt at them (i.e. just do the work and they will come) didn't reach far enough for anyone in positions of enough power to take the effort seriously. This resulted in a somewhat disconnected hybrid method which saw lower levels doing the work with upper levels of management and EA imposing design on the teams, with PMs backing up the EAs as authority on that work.

In addition to that, teams spent the vast majority of retrospective time generating new ideas for working together (good, bad, change) including grouping tasks, voting and setting options for the next iteration. However, no retrospective ever came back to check that these did indeed improve the process and any overhead we introduced as part of the each task was actually worth it. Further actions just built on top of these actions and you gradually built up greater overhead in each iteration.

The team had successfully implemented WIP limits (though that started off quite painfully) and were measuring cycle time and throughput since this was easy for them to visualise in a JIRA Dashboard. We saw a burn down but it wasn't clear whether our flow was any good and indeed, whether we were improving at all.

Add to this the need from classical project management to get an idea of the length of time things would take as well programme management to align the streams of work meant we had to get to know something about whether we can actually hit the hard deadline. Those that know me know I think aligning work the SAFe way or classical PERT way introduces inherent risks, but the environment was what it was and each change begins with a small step, not a 'Big-Destroy Enterprise Programme'. After all, as a dev, you're an easy replacement anyway to that style of culture (not that you necessarily have to worry about it in the IT game but it's an important consideration).

Who wanted it?

The graph/points estimation wasn't necessarily to get the team to improve delivery per se. That was not the purpose of the exercise. It was to give confidence that when we were challenged to produce an estimate, we could do so reliably and provide some confidence to the supporting classical thinking personnel we're talking to that we can and have delivered x features in t. It was to lower the variation and give confidence to those who wanted to support us that we could deliver and were improving. This was a tool to help them do that and get the buy in they needed, which took half an hour a week for someone to do (indeed, I did it - but any scrum-master or tech lead can do it in an enterprise context).

Why should you care?

The answer depends on the context you work in. In an agile-sympathetic environment, this isn't really necessary at all. After all, everyone is confidence and comfortable with change. However, where a hybrid exist or companies are transitioning, sometimes these conversations are necessary. Later on, they may not be relevant any more. Enterprises can evolve as much as people do.

The Follow-up Questions

During the talk, some questions were asked and I agreed to produce some follow-up graphs from the data. In order to understand some parts of this, I'd suggest you go back and read the method presented in that blog post, as this will explain what look like 2-pt and 5-p story 'anomalies' as we shifted our understanding of story sizes.

Cone of Uncertainty - Variation Over-time

Specifically, taking the variation between our expectation and actual delivery, plotting it and calculating the Coefficient of Variation to standardise the scales of the graphs, we can plot the change in the coefficient over time. What we see for each story size (in points) is this:


Story point variation (CV) and polynomial trend line

To keep things simple(r), I've added a cubic polynomial trend line to illustrate a smoothed variation. I haven't done anything else to the trend line and Excel has chosen the shape that minimises the sum of squares. We can relate actual uncertainty to the variation in story point figures. The same downward trend on variation is seen in linear and logarithmic trend lines. As you can see, most trends show the reduction in uncertainty as we recalibrate our positions.

Limitations

The only exception to the general trends are the 8-pt story sizes, which curve slightly upwards (not significantly enough over linear to be concerned about). Additionally, due to the team rightly reducing larger 13 point stories into smaller stories, there are only a few 13 points stories in the dataset. I argued there were not enough to come to a conclusion or indeed worry about going forward, especially most became 8-point stories as a natural part of story splitting and recalibration (again, read the previous blog post).

Conclusion

As I explained in the talk the other day, estimation such as this isn't an end goal. This is a technique in the repertoire to provide confidence for those who can support us to become more agile. After all. working in the Enterprise Architecture space necessitates communicating in many different companies, with many different types of stakeholder, including non-technical personnel/those without a software development background. Not ever EA problem is a software development problem. Indeed, to approach it from that perspective architects before it's necessary, if it needs it at all!

Digression

As an example, consider walking skeletons, which can be just as problematic in code, since they make explicit choices on the technology stack way before a decisions is needed on the suitability or otherwise of the tech, but they are useful tools to experiment when you have a tech stack already and gain certainty. However, employing just a walking skeleton is like having Maslow's Hammer. It risks introducing technology into a non-existent current stack when the basics of what people want are unknown. In this case, you don't need a skeleton per se. Just throw together a UI mock up and deploy that to a static environment (even a file system) to get people using it to input data that never gets stored. This can be done in a few minutes compared to creating a walking skeleton which can take a couple of hours to get the same amount of feedback and can be potentially constrained by infrastructure problems and will require some prerequisite work. So bang for buck, if the question is trying to find out of Henry Ford's customers wanted faster horses, this would be cheaper to do than a walking skeleton and yields just as much value. The second meeting can fill this out with a skeleton if you want, since by this point you have more information to base choices on.

Risk and Sensitivity

You have two non-mutually exclusive choices to deal with risk. The first is to reduce the chance of it occurring, which this technique fits into. The other is to mitigate the impact should the risk occur. Which this doesn't address and isn't intended to. So this can only be one of many tools in the team's arsenal in dealing with tracking, recalibration and risk reduction and as we can see, there are specific scenarios this addresses really well. The question is, what other techniques exist to address the same problem?

Further Updates

I will answer some of the other questions in time and post them as updates to this blog.

Wednesday, 29 October 2014

Cone Head!!

A topic that seems to come up time and time again that folk seem to either take to or not, is the idea of an 'uncertainty cone'. I briefly touched on this in a previous post where I was violently disagreeing with Woody Zuil and Nick Killick, not on their principle of #NoEstimates, since the method has definite merit, but on the specifics of the merit that it has.

I'll take this time to explain a little more about the cone of uncertainty for those who are not familiar with it, or who would like to see a more practical example of what it is. To do so, let's consider 10 flips of a coin as the example. There are 2 to the power of 10 possible combinations of 10 head or tale results.

Before rolling the die a first time, I want you to guess what the final total may be. How many heads do you think you'll get?

Well, if you think about all the combination (0 heads, 1 head, 2 head...) and thus build a histogram of all results, you get this:

number of heads when flipping a coin 10 times - University of North Carolina (via Google images)
I'll come back to this later, but you should have a number in your head. Let's now consider the range of all possible numbers of heads at the end from this point. i.e. before the first flip. You can either get a minimum of 0 heads, or a maximum of 10 heads, or of course, anything in between right? Cool.

1st Flip

When you flip the coin the first time, it comes up say, tails. This does two crucial things:


  1. It gives you an actual result to work with, so you now have 9 uncertain results and 1 actual result.
  2. Now that you have flipped a tail, you cannot get 10 heads. Given that in the above histogram which applies all the time, there is only one scenario, that scenario is now out! The best you can hope for is 9 heads, given you've flipped 1 tail.
Drawing up the table of min and max heads after the first flip we can see:

2nd Flip

Flipping the coin the second time, it comes up say, heads. This also does two crucial things:


  1. It gives you an actual result to work with, so you now have 8 uncertain results and 2 actual results.
  2. Now that you have flipped a head, you cannot get 0 heads, because you have at least 1. Given that in the above histogram which applies all the time, there is only one scenario with 0 heads, that scenario is now out! Your rage is now 1 head to 9 heads.


Put this in the table and flip again. Follow the rule that if you flip a head, you increment the minimum by one, otherwise you have flipped a tail so decrement the maximum heads by one (because you now don't have enough flips to get the previous maximum).

<<Fast Forward>>

10-Flips


10-flips completed

So we've completed the whole 10 flips, incrementing the minimum if we get a head and decrementing the maximum if we get a tail. Surprise surprise, by the end, we have two ends that meet in the middle (which is correct, because by that point, we have 10 actual results and thus, no uncertainty at all). You can double check this by counting the number of heads you got, which is 4 in this case, against the meeting point of the maximum and minimum, which is 4. If you don't, then you've banjaxed your counting, so you might want to ask a 3 or 4 year old for help next time.

Making the Cone

From this table, we simply have to plot the flip number against the minimum and maximum number of heads. So let's do that. I've also included the trend lines, in black, which show the trajectory of the minimum and maximum numbers. The gap in the middle is the level of uncertainty or variance:


cone of uncertainty

Let's recap what happened. At the beginning, we had no idea where we were going to end up [with how many heads], aside from the range of 0 to 10 heads. As we progressed, we reduced the size of the range of possible 'options' or heads we could get and by the end, we were where we were.

Map this to typical IT projects. At the beginning, we have no idea where we're going to finish. As we progress and choices are made (which honestly do sometimes seem random), we reduce the total number of potential options that we have (which isn't always a bad thing, especially if we discount the highest waste or risk options) and eventually, we come to rest somewhere. Also, despite everything, we always know where we're are starting. We're starting 'here'. The end of the last cone (or part thereof).

And the First Histogram?

Returning to the histogram, which is built up from a knowledge of all possible combination of coin flip (it is a closed probability space mind you, which isn't always the case in software), you can see straight from this that the best options for your guess is 5 closely followed by 4 and 6 heads. The curve is a bell curve, aka Normal Distribution, and in this case it is fine.

Epilogue

The only real difference with development is the probabilities in software development are somewhat conditional, since the decisions we make are not random, but somewhat stochastic, or at least Bayesian, since we ourselves learn and make better decisions or become more productive, which help us descend the cone faster. It's good enough, so should still be used, but if you're a masochist, then I best at least tell you that something has recently come to my attention in the field of theoretical statistics which may be useful for the part that is currently quantified normally. That something is the Tracy-Widom distributions, which appear ever to slightly skewed to the right. It's not something I've used [yet] and it is somewhat advanced, but I am excited to see where this field goes.

Monday, 16 June 2014

Network Analysis: The 2nd Coming

Many moons ago, when I was young and you were even younger... that's not strictly true, I am probably younger than a lot of you even if the face in my mirror doesn't show it... techniques such as PERT and network analysis were fairly mainstream. Indeed, process improvement methods such as Kaizen and Six-Sigma still use network analysis as a mainstream tool to flesh out some of the flow in much the same way as modern systemic flow diagrams are used to track flow of working software from business ownership to production.

A fellow HiveMind expert practitioner, Ian Carroll uses presents systemic flow mapping in his website, which is well worth a read if you're not familiar with the concepts. He also expands on the evolution of this through different stages or 'mindsets', each of which brings benefit and adds to process maturity.

There are many benefits to mapping your process this way. Flow is one thing, as following that chain back to front you can find the bottlenecks in your system. However, as with a lot of agile techniques, a lesser known benefit is that it allows you to understand risk very well. Systemic flow gives these classic techniques of applied mathematics a new lease of life, especially when considering it as part of base-lining business architecture or business process during a transformation programme and using systems thinking approach.

The Problem

Having mapped a systemic flow, or when creating a classic PERT chart in ye olde world, you often find a series of dependent tasks. That in itself is cool and systemic flow mapping doesn't add much that's new in that regard. In PERT, each stage of a chain had a probability of hitting its expected date m (the 50% threshold) and a standard deviation of s. I'll save the details of that for another day, but the important thing to note is there is a level of risk around this and this risk would propagate through a chain.

Now substitute the term 'statistical dependence for 'risk' in my previous sentence and read it to yourself. I hope you can see how this more general concept can be applied to any chain of any type and can help you understand trade-offs as well, such as parallel tasks versus risk.

To illustrate this, consider the two chains below. The GO LIVE is specified for a particular date in the future, whether a hard deadline through a compliance or regulatory reporting requirement, competitive advantage in seasonal industries or other such reason.

Sequential Chains


Sequential task processing

Here there are 3 tasks that need to be completed. The percentages show the probability that a task will complete 'on time' (either in waterfall projects, or indeed, delivering those tasks in a sprint). The tasks are effectively mutually exclusive, given they don't occupy the same probability space, but they do have a dependency, which means that the probability of their success is dependent on the task before. For those conversant with statistics, you'll recognise this as:

This level of uncertainty is normally gleaned from previous performance and 'experience'. For example, manufacturing processes or system design activities. I previously covered how to reduce these risks by chopping up tasks into thin slices, as improves the variance and hence certainty.

So considering the chance of Going live on time, all tasks have to complete on time. So the probability of completing on time is simply the multiple of all the success probabilities, given these conditions:

Sequential Conditional Probabilties


So a 28% chance of completing on time!

Shock horror!

Parallel Tasks

"Cha-HAAAA! We'll just run the tasks in parallel!"...

...I hear you cry. OK, maybe not quite like that (stop with the mock Kung-fu already!). The point is, contrary to popular believe, this only improves the probability of success if running those tasks in parallel then gives each task a greater chance of completing before the GO LIVE date! After all, they all still have to complete:

parallel version of the same tasks
In this scenario, the go live can only happen when all individual components come in at the same time. Hence, we can model this with non-conditional probabilities and yet again, the chance of hitting the deadline is:

However, most of the time this does result in some improvement in probability of success, but not usually as much as you think, as workload expands to fill the time available for it (Parkinsons Law). It's what project crashing was in the original PRINCE method, but because of this darn law, it never changed the risk profile (aka probability density function) and because the tasks were so big, the uncertainty around them was extremely high anyway.

I have come across parallel tasks like this several times, where say, Task 1 is the hardware platform, Task 2 is the code and Task 3 is a data migration. This is risky!

The Solution

As per vertical slicing, the key is to segment the tasks so that each can be deployed as a separate piece of work, able to deliver value to the organisation even if the rest of the project doesn't make it, is canned, or is late. It's about breaking the dependencies all the way along the chain, so that the statistical fluctuations of ToC are removed (so if the statistical fluctuations do happen, and they will, who cares?) for those of you familiar with theory of constraints or queuing theory. Looking at how this would works:


Three separate deployments to live

This time, tasks 1, 2 and 3 all deploy functional projects into production with the same risks as before. Looking at the individual risks, they are 50%, 80% and 70% respectively. Given the overall success rate of both the previous methods was 28%, this is a significant improvement, without even considering the real life benefits of greater certainty.

You can apply this thinking to much more complex streams of work. I'll leave the following exercise for you readers out there. Take note that the conditional probability 'carried over' to the next task has obviously got to be the same for each successive task. For example, Task 1 has a 60% chance of coming in on time and hence Tasks 2 and 3 both have the same probability coming in. I know how keen you are to give this a go ;)

Give this a go!

Conclusion

As you can see, where an organisation hasn't made it to the "Mature Synergistic Mindset" that Ian Carroll introduces in his blog (i.e. vertical slices) the structuring of projects and programmes can rely very heavily on this sort of process to find where stuff goes. Risk is only one aspect to this. You can use the same technique, where the arrows map waste time (i.e. time spent in inventory) and then use say, IPFP or linear programming with appropriate constraints to find an optimum point.

However, be careful that this is an in-between technique, not the goal. The goal isn't to have the analysis, it is to make your process more efficient by reducing dependency, and the impact of statistical fluctuation on your project.

Monday, 2 June 2014

The Smaller The Better

A while ago, I wrote a couple of posts about agile estimation and specifically, how I evolve estimates as projects run. I also wrote about the #NoEstimate movement what I take away from that view of estimation.

There is also a little programming exercise I was shown once, known as 'the Elephant Carpaccio' by Alistair Cockburn. One of the agile signatories I have a lot of time for. The aim of the contemporary version is to find out how thinly you can slice an elephant (aka your code) so you can write a test, code and then deploy a tiny tiny change, perhaps even one single line, into production.

What is interesting is that the smaller the change, the less the variance on that change. I sometimes do this by asking a group of folk to estimate the size of a line, which is usually quite small (in the order of an inch or so) and then ask folk to estimate the size of a much larger [elephant sized] line. What you almost always see is the standard deviation of estimates of large line size are almost always much higher than those in the smaller ones.

You see this in both story point estimates and indeed the variance of waterfall/RUP/no-method projects as a whole. No doubt we've all been in companies where small projects haven't really been that late, or cost that much more than predicted, whilst larger, more complex projects have taken or cost several orders of magnitude more (luckily, not that many at all for me).

Now, you should know by now that I like to prove things. Using empirical data and statistics to find out perhaps useful angles on things or validate a hypothesis. This case is no exception. I am going to use a previous dataset for this, gleaned form issue tracking tickets, their estimates and the cycle time of each ticket (duration the ticket spent from being opened to being closed at done).

Basically, I am testing the hypothesis that the standard deviation of higher valued tickets is greater than lower valued ones.

Method

Taking the number of tickets, their point sizes and their durations, I constructed a table of averages versus standard deviations for all Fibbonacci sized ticket (1,2,3,5,8).

Results

The results of the analysis are shown below:


The key thing to note is that the standard deviation for a 1 point story (+ or - 1.088) is significantly smaller than any of the others, with intuitively, an 8 point story having a larger deviation.

Why Care?

This is important because if you want a level of predictability, not just with time, but with effort, cost and anything else, the indication is to make the stories as small as possible.

The key thing with agile processes, is they fall into a class of statistical process. Specifically, an Ito process, akin to Brownian motion (I know, this is where it gets sexy).

Each individual ticket can be considered to have a 'predictable' component and a random variation around that. Stochastics is more than pure probabilistic methods, either in classical statistics, where predictability is not assumed to exist at all, or Bayesian statistics (where the posterior probability is gained by improving the a priori statistic, given the presence of new empirical evidence). For devs this is like knowledge improving as you gain more knowledge of the domain, which manifests when the team 'learn' through experience (I personally think Bayesian statistics holds the greatest promise of modelling an agile development process by far. Another story for another day). Stochastics assumes there is a level of determinism and a random component which us agile practitioners could consider to be caused by sickness, additions of new folk, unforeseen circumstances, team members leaving, meddling or whatever else can affect the flow of the team.

The result of the above experiment, as well as carpaccio exercises and my 'estimate the line' game all seem to suggest that if we make the tasks as small as possible, simultaneously reduce the variance. Eventually you'll find the variance from the expected time is so small as to be negligible. So keep things small and keep your chances of success high!