Tuesday, 8 July 2014

Kanban in IT: Why You're Probably DOING IT Wrong!

Despite it's age, especially in other fields, Kanban is a relatively new addition to the IT world. As someone who is easily just as inquisitive about the development process and working more effectively and systemically, when Kanban was mentioned all those years ago, I looked at the history of the process, put my mathematical hat on, my searching boots on and started to try to understand these systems in more detail.

For those who are not familiar with Kanban, it originated in the manufacturing world. Specifically, it stemmed from the study of supermarket demand in the 1940s which and later became the Toyota production system (TPS) in Taiichi Ohno's seminal work from 1988. Get that? Started in the 1940's! Some 60 years before IT ever got its hands on the idea.

The method became arguably the most solid foundation in Just-In-Time manufacturing bringing unparalleled and unmatched production quality and speed to the Japanese car market. As a child of the 80s, I remember the sheer envy of the rest of the world of the Japanese market, which at the time outshone the German market for efficiency. It even caused a plethora of Hollywood films about firms being subsumed (aiming to, or avoid) by Japanese companies, such was the dominance of the Japanese car market at that point.

Additionally, whatever you think of process improvement methods, Lean-Six Sigma and Kaizen both use Kanban process as cornerstones of process improvement techniques & there are a number of mathematical and statistical studies of the technique which have also delivered some heuristics to follow. So again, old hat.

As a software development professional, I use Kanban all the time and as an agile early adopter, I have done for a good, long while. However, one thing that always crops up, which I believe is fundamentally wrong, is the notion of tickets moving across the board as the work items themselves. I often have to reiterate the ticket isn't the work item, it's a representation of the needs of the work item. A Kanban signal!

Now, in true [just after] 80s style, you can watch some videos explaining the manufacturing equivalent of the pull system:

https://www.youtube.com/watch?v=w3Ud7pEhpQM

Kanban has been used in manufacturing, healthcare, baking etc. and the only one that I admit to taking umbrage at is the software dev Kanban and here's who. Pay particular attention to how this works! A key takeaway is that information flow, the ticket which includes the 'specification' of the batch size/container, flows from right-to-left, whilst the implementation (real thing) flows from left-to-right.

Self-flagellation? 

No, I believe in being realistically critical enough about our own work to find the points for improvement. Admittedly, some folk see this as me being negative and make no mistake, there are times I am especially when trying to get some teams to think about change is like head-butting a wall over and over or swimming through treacle - There are only so many times you can keep head-butting that wall before you cease to add value. So companies without the necessary buy-in can learn the hard way when their competitors overtake them and if some staff then leave or are made redundant, they company and staff find themselves without the requisite skill-set to compete with other candidates on the market. It is a huge problem in the IT world especially and one of the reasons why some people were forced out of the industry as agile methods took over.

We also need to reframe this as learning, not criticism. Especially when considering (For those of us lucky enough to have some understanding of optimisation), a theoretically optimal system isn't guaranteed to be unique in any situation! So you can get more than one optimum so there is more than one right answer at the time. In the case of manufacturing or economic systems, this is because there are often more variables than there are equations to solve them (implicit or explicit). So this naturally becomes an optimisation problem with almost always more than one solution, but those solutions do exist and can be found through iterative methods. 

Whilst I was involved in the creation of the mathematical algorithm and ran that derivative of IPFP for the UN Development Programme's JOrdanian Social Accounting Matrix in 2012 (based on matrix-raking - it's an iterative algorithm) Kanban modelling doesn't need that level of sophistication. For a lot of problems Linear programming is a sufficient way to look at these systems. However, this is outside the scope of this article, as much as it pains me to say it :) So I'll stick with giving you top-3 tips, but assume you're already segmenting customer feature end-to-end (i.e. entire thin Lines of Business).

TOP-3 TIPS


1. Kanban is a Pull-System

CORRECT! It very definitely is a pull system! So why are you pushing cards across a board? Stop doing it! Think about how you can signal that a task is ready to be pulled. Some folk use smaller green stickers/tiny post-it notes etc. 

In my mind, and this isn't shared by everyone (but everyone has been wrong before ;), the ticket represents a container for the item you're producing (whether that is a feature of a system, with many features going into an epic container for the MMF or MVP) or a physical item, such as a container for a 'Login page'. The item is not the login page itself.

The filled container is what the customer wants. If you're Kanban process looks like the following deliberately not perfect example:
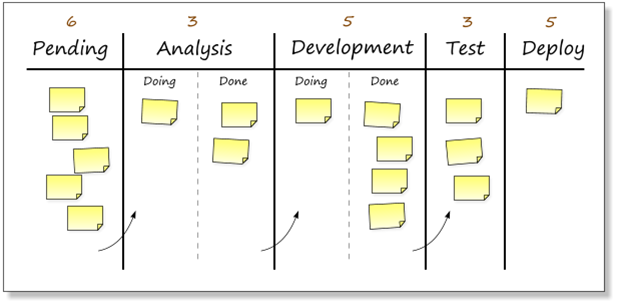
image from bob's lean learning

The arrows represent where the items go when they are pulled form the previous stage, not pushed once done. At the end of the flow, the deployed container is what the customer gets. The customer pulls this from the test stage once it's ready, which pulls this from the development stage once it's ready, which pulls this from the analysis stage once it's ready, which pulls the 'material' from the pending backlog once it's ready. The specifying pull-signal moves from right-to-left. From customer needs, which effectively specify the acceptance criteria for the system through behavioural tests (BDD/Gherkin) or even just BOLT ("As a... I want... so that...") through to picking up the raw materials (tools, projects, repos etc) at the very beginning. You'll note one crucial and perhaps controversial thing... DEVELOPMENT IS NEXT TO LAST!!!!

Before you start shouting off, this doesn't mean that developers are last, inferior or can be demeaned. After all, you're working in multi-function teams and this is a stage not your job or role right? 

Even if you are in charge of it and are feeling insulted or devalued now, ask yourself why that is? Are you protective over your role in the team? Is it Test-Driven Development you are practising? If so, what do you think that truly means? Does the customer care (or is their value measured) by the teasing out or refactoring of tasks which don't pass acceptance tests, glean feedback or deliver much needed value? No, of course not (you better agree!) because the old agile statement about the code being the final arbiter is complete rubbish and has been one that I've thought ridiculous from the start! Whether it delivers value is the true arbiter of the worth of the code and the efficacy of the team. All those feelings of anxiety that may manifest are indicators of 'threat' and dare I say, were felt by the people who were told to move to agile environments some 15 years ago at the turn of the millennium. Indeed, I myself felt them at the time and there is an important lesson in that.

Take a look at this video for 5S a lean manufacturing improvement vendor and see if you can spot some of the things which also conceptually apply to software development (SPOILER ALERT! "All of them") then think about how this can applied in your org:


Or how about this video of a an office space? I think there were more points in this for improvement (HINT: the business cards)


WATCH FOR: No visual indicators of 'ready', usually accompanied by people moving cards into the in-tray of the next stage to the right once complete. This is the same as using 'in-trays' and runs counter to Kanban. QA not being involved (or taken seriously at retrospectives).

TIP: Get small stickers or post-its to show that a task is ready to be pulled, or perhaps have a sub-column for tasks that area ready.

2. Pull-Signals Flow Right-To-Left

Information in the form of pull-signals makes its way from the right hand side of the board to the left hand side of the board. Compare this with a manufacturing plant, where different stages in the process often have differing levels of local inventory, for different parts of the whole. For example 4 screws are used to mount a single kickplate on a door which is pulled as a trolley of doors and kickplates, with the screws at the bench.

In software development a feature is a particular item of meaningful functionality. After going 'backwards' through the testing stage (which remember, is just the container/pull-signal for the work) this may get broken down into smaller architectural chunks, which may have TDD tasks wrapped around them. 

Can you see what I am suggesting here? Yes, QAs are effectively your architects. If you're a developer, then I expect there's PANIC! But again, it is TDD you're practising right?...

The truth of the matter is the market isn't currently aligned to this idea at all. Companies still value testers much less than they do development staff and as a result, most people with development skills do not move into testing roles else they earn around 17% less in salary terms, though the contract market is much better aligned. Until this changes, the motivation for better, more technical test staff will simply not be there.

WATCH FOR: Classic indicators of this are where developers run (and talk most at) the stand-ups, a developers is, say, a Scrum master or team lead, the developers drive change, look at technology choices before customer value, the retrospectives are not data driven or are otherwise poor and the team use only one type of testing process (such as TDD) with no attention to behaviour, increment size, load and/or performance testing. Whilst not exclusively the preserve of developers, it indicates both siloed thinking in job role and no strength being attributed to the test side of the team.

TIP: Encourage buy in from the team and make them aware that the QAs run the testing process. Encourage pairing for KTP and the breaking down of features led by the testers, not the development staff.

3. Business Analysts are also your Feedback!

More often than not, a business analyst is found on a team and they illicit requirements. They also look at the business process at hand and determine the value of the tasks but rarely do I see a business analyst be involved in decisions and reporting ROI and team and capability effectiveness. This is the missing link.

When working lean, the aim is to get feedback on how well the business vertical is working. A business analyst does exactly that! They have to look at the customer value of each and every story and determine the cost-benefit of doing each [thin business vertical] task. They will also help determine the Rate-Of-Return and the Return-On-Investment of a project in the customer's mind as well as look at the customer experience elements, both inside the outside the team. Together with the QA's they are crucial in determining how effective the team are, how well they are working together and determining the scope, location and exposure to any points of waste or constraints in the process. They will be skilled at determining the appropriate contextual metrics and constraints (a bank is different to a mobile social media app start-up) and monitoring the necessary measures of value.

WATCH FOR: Retrospectives without numbers or no change in waste, blockers or bug numbers in each iteration over a period of time or no predictability in flow. This is likely nearly every one you'll ever attend (and is why they're wrong). Some companies, such as Lastminute.com have moved up a level, but they are very very rare!

TIP: Get the business analyst to think about operational expenditure and how the team adds value. If you take the brave (but I think legitimate) step of align reward to profitability, then the business analyst will be crucial in determining that for the team. This will include finding the internal independent variables influencing flow, cycle-time and throughput/velocity, such as number of blockers, bugs, enhancements and other levels of waste.

Summary

Moving to lean from just plain agile is a tough ask for a lot of companies anyway, whichever field they're in. This article gives you necessary but not sufficient things to look for when walking the floor at your company. 

Note, there are better companies out there than us in other fields and we are guilty in the IT world of not being humble enough to understand that. It isn't that the problem of Kanban is any different in software or product development (at least I can't see a significant difference), just that our grasp about what a batch or container is, is very muddy. We can and do use story points, but need to attach these to features which combine into epics and hence make up MVPs and MMFs. Other techniques such as creating thin slices of functionality reduce the variance enough to introduce a reasonable element of predictability into the container or batch size. 

We also think that development is the cornerstone of the business, which any CEO will tell you, isn't true. It's an enabler, often to a product or service which pre-dates computers. If they could get something to do it as fast, but without the development overhead, they'd choose it over developing software any day, as there is much greater uncertainty in software. We already see this inside the IT space with build or buy decisions. So the role of business analyst and QA is crucial in process optimisation and it certainly isn't the preserve of the development team.

Teams inside and outside organisations need to make sure they understand that they are also part of the value chain. Your customer takes a problem, adds value in the solution they create (which includes the software they get you to write) and 'sells it on', providing a solution to their own customers, who may be Joe Public. If you've worked in B2C or B2B service companies before, this is always the case. Being in IT doesn't lose you the economic reasoning and truth be told, in capitalist environments, I think that's unforgivable if you think that's the case. 

Happy Leaning!

Tuesday, 1 July 2014

The Drawback of Shared Services

In many organisations, the concept of shared services is a pretty standard one. A shared service doesn't sit on a line of business, but is a cross cutting concern for across all lines of business. Examples of shared services are Human Resources, Marketing, IT, Finance and Regulatory Compliance.

Shared services came about because it's easy to segment such business functions into individual cost centres, potentially even into single accounts within a company's CoA (aka charts of accounts) which do make things much easier to report on. They also seem to have evolved functions at board level, such as CFO, CIO and CTO.

In recent years, it has become clear that this is a somewhat wasteful idea for a number of reasons and in the reporting sphere, not least because the end of month, quarter and annual reports and management accounts occur so infrequently relative to the lines of business operating all the time. However, there is an even bigger problem with this and it is the level of complexity this introduces into the organisation's operating model which happens to also mean that any operational task spanning multiple shared services contends for its time, is more complex to manage, passes through several chains of responsibility and due to the contention, generally takes longer to pass through the operating chain. For this intro, I will skip a significant portion of the maths, but the whole process of illustrative relevance is based around queuing theory.

Modern methods which aim to make organisations more responsive, such as Lean Start-up or agile software development, have inadvertently stumbled onto the answer. The reason they address this pain point so well is they amalgamate functions of all the various shared service centres into one, self-sufficient team. This type of organisational unit makes it really easy to manoeuvre in the space, shortens the time through the queue (aka the cycle-time) and inherently reduces complexity. Today I'll work through an example of the problem and compare this model to the newer, more agile cross-functional teams.

Traditional Hierarchy

In a traditional shared services hierarchy, you may have a chief operating officer who is responsible for the operations of the enterprise, which will include operational services, call centre management and such like. A CTO or CIO who has responsibility to deliver IT shared services. Some companies have CMOs, of course, CFOs exist etc. What is often correlated with that board structure is a hierarchy of specialisms. So an accounts division or department, a marketing division or department, an information systems division or department.

The interesting thing is that managers who have been through typical managerial courses, especially at MBA level, will have drawn up 'value chains'. These chains start with a raw material, and refine it into an end product. Alternatively, they begin with a customer entry into the system and travel through a series of steps, services or stages through the organisation before coming out at the other end, healthier, wealthier and wiser.

Consider the following organisation:

Typical organogram

Let's suppose this represents ACME plc. That wonderful road-runner extermination device provider. Coyote is getting old and needs ACME, who he has bought products from for decades, to come in and do the extermination for him. For this, there are a number of processes at work.


  1. Coyote, an existing customer, contacts the Customer Services department 
  2. They are put through to sales and purchases a consultation with an engineer. 
  3. The Sales adviser finds Coyote's details in the system and created a sales entry for an engineer visit.
  4. Through communications: 
    1. Engineering gets a request which waits in a queue until an engineer is assigned. 
    2. Legal prepare a new agreement for the extra work and send it out
  5. Engineering schedule their work and assign an engineer to come out, but not before conducting a quick risk assessment.
  6. A notification message is returned to a CSA to notify Mr/Ms Coyote (could you tell?) that they should expect a visit in some 8 hour window on a day some time from today.
  7. An engineer arrives at Coyote and does whatever business they do.
  8. The engineer finishes the consultation and registers the completion of the job.
  9. ...Which triggers a journal entry in Accounts, incrementing the bill which in turn formalises the contract. This waits in respective queues until officers from each department get to them.
  10. At the end of the month:
    1. Accounts run a report for the board on the sales which include Coyote's new order and...
    2. Marketing Analysts determine the performance of the previous month's sales v costs and effort and adjust for the next month. This is reported to the board and...
    3. Marketing prepare a press release to tell the world they helped Coyote finally catch roadrunner.
    4. Credit control raise invoices for all purchases, including Coyote's.
If we map this to the departments and division which the order touches (which remember, is a proxy for the view of the customer ACME have):

ACME activities in Coyote's Value Chain

What's wrong with that?


...I hear you ask. Well, if every department reacts as soon as they get the notification, absolutely nothing. However, in reality, this never happens! Different types of tasks contend for personnel's time. Crucially, because it's a shared service, Coyote is not the only customer that each shared service in ACME has, nor is Coyote's request the only type of request that a department processes (it's the nature of shared services after all).

ACME, having branched out, now have clients including Family Guy Peter Griffin, Chief Wiggum from The Simpsons and Roger Rabbit all wanting different things from the sales people or customer services, maybe calling up customer services to get in contact with tech support etc.

So let's add some numbers to that workload. The arrows represent how long it takes one [red] item to flow in and then out of each subsystem. Effectively, for tech guys, this is your departmental 'cycle-time' and is the difference between the arrival time and the service time. The red dots, where highest priority is reserved for the item on the top right, denote all the work there is and X is Coyote's task which passes into each department at that position in the work queue.

Aggregate workload


In each subsystem, counting each dot from highest priority to Coyote's cross (inclusive) and multiplying it by the time in each corresponding arrow, we get the time that Coyote has to wait. Doing this for all subsystems to the point at which Coyote gets a bill, marketing get an idea of whether their latest marketing campaign has worked, the board get a view of how sales of the consultancy service are doing etc. is:

Total flow of Coyote's new sale

Note that due to the request being able to come in at any time in the month and us using the very best case of the final day before the reporting run, that is an absolute minimum of 201.75 hours! 201.75 hours! At best over 25 days! That is a minimum of 25 days (and maximum of 55) before marketing can get an understanding of whether or not their campaign worked; the data showing up on the financial reports; the PR exercise coming through (potentially allowing your competition to get in before you with something more interesting for your customers); and before an understanding of your company position can be made! Not to mention crucially, that's 25 working days for your customer to get through this business process! If your cool off period is 14 days, what do you think this leaves them with? The road-runner is certainly long gone!

Working More Effectively

The key to being agile is responding to change and hence knowing faster, working faster and hence reacting to your market when you know you need to change. To 'know it' you need to be able to sample the effect on your market of a campaign and your customer's journey is crucial in this respect.

In this scenario, think about switching capabilities from horizontal structures built around the technical services your company provide to each other department, to a fully aligned business process with one member of each of the departments concerned in one, single, cohesive team. The work is also aligned so that it doesn't go out of order. This time the team consists of all members of operational staff and they focus on each case as it comes in, aside from the engineers, who have to take 2 days to schedule and work on their tasks in bulk, as they are out on the road. Let's assume that we remove 50% of the types of task that each department member deals with, so they focus only on this service. The reduction naturally means that they address needs that come in more frequently, using only one type of process, which  naturally reduces context switching. To keep things simple, we'll assume a zero-cost  context switch for this demo and we can imagine the saving not context switching gives. It will just add to the benefit.

There is always a way to improve. However, a first transition may yield:


New flow arrangement

Conducting the same analysis on the above yields.

Newer, aligned processes

WOW! What happened?

That's a bit of a difference eh? Now ACME can see the effects of a marketing change on Coyote (or anyone else) in less than a week! The removal of invoicing from the month-end shared service process also both shortens the cycle-time AND reduces variance! Imagine that? The ability as a CEO or COO to know how your organisation is doing and you will not be more than 1 week out of date and be pretty certain of the result! This compares to more than 5 weeks to up to 9 weeks in the previous example. That means you can assess your market standing in less time and know when to change with a high level of certainty. It also means you don't spend so much of your revenue if a process doesn't work. Given the fixed costs of ACME's wage bill and overheads, it would be paying 5 weeks worth to find out what you could have done in less than a week! That means at worst, you are 5 times more efficient and being aligned to the appropriate value chain, shifting 5 times as much traffic through ACME's system translates to being around 5 times more effective! Thinking about this as a factor in the Rate-of-Return of an investment and suddenly this looks very good indeed!

Summary

The process above shows the difference that the use of multidisciplinary teams and systems can have on your business process. I've left out some of the complex details, such as task variance and hence system variability.

Make no mistake, moving to a more agile business architecture is a culture shift, requiring a significant change in mind-set. Most organisations and indeed managers have spent a lot of time being told that shared services are the way to go and most staff assume hierarchies are the norm. After all, we get 'promoted' and gain higher salaries for higher positions. Hence, changing that will require small, careful, iterative change management, aligning services that already have some overlap with (and hence sympathy for) other services is the path of least resistance and the best road to travel. Take care to run those for a little while and see how it copes. Address issues as they arise and see where the system constraint moves to next (a la Theory of Constraints).

Whilst I am certainly can't advocate the removal of shared services where they are already aligned with the value chain, customer experience or workflow, I do caution that you look out for 'shared services' that appear to be essential to the operational flow, as these are the ones that need to be carefully reshaped. Happy reorganising!
Monday, 16 June 2014

Network Analysis: The 2nd Coming

Many moons ago, when I was young and you were even younger... that's not strictly true, I am probably younger than a lot of you even if the face in my mirror doesn't show it... techniques such as PERT and network analysis were fairly mainstream. Indeed, process improvement methods such as Kaizen and Six-Sigma still use network analysis as a mainstream tool to flesh out some of the flow in much the same way as modern systemic flow diagrams are used to track flow of working software from business ownership to production.

A fellow HiveMind expert practitioner, Ian Carroll uses presents systemic flow mapping in his website, which is well worth a read if you're not familiar with the concepts. He also expands on the evolution of this through different stages or 'mindsets', each of which brings benefit and adds to process maturity.

There are many benefits to mapping your process this way. Flow is one thing, as following that chain back to front you can find the bottlenecks in your system. However, as with a lot of agile techniques, a lesser known benefit is that it allows you to understand risk very well. Systemic flow gives these classic techniques of applied mathematics a new lease of life, especially when considering it as part of base-lining business architecture or business process during a transformation programme and using systems thinking approach.

The Problem

Having mapped a systemic flow, or when creating a classic PERT chart in ye olde world, you often find a series of dependent tasks. That in itself is cool and systemic flow mapping doesn't add much that's new in that regard. In PERT, each stage of a chain had a probability of hitting its expected date m (the 50% threshold) and a standard deviation of s. I'll save the details of that for another day, but the important thing to note is there is a level of risk around this and this risk would propagate through a chain.

Now substitute the term 'statistical dependence for 'risk' in my previous sentence and read it to yourself. I hope you can see how this more general concept can be applied to any chain of any type and can help you understand trade-offs as well, such as parallel tasks versus risk.

To illustrate this, consider the two chains below. The GO LIVE is specified for a particular date in the future, whether a hard deadline through a compliance or regulatory reporting requirement, competitive advantage in seasonal industries or other such reason.

Sequential Chains


Sequential task processing

Here there are 3 tasks that need to be completed. The percentages show the probability that a task will complete 'on time' (either in waterfall projects, or indeed, delivering those tasks in a sprint). The tasks are effectively mutually exclusive, given they don't occupy the same probability space, but they do have a dependency, which means that the probability of their success is dependent on the task before. For those conversant with statistics, you'll recognise this as:

This level of uncertainty is normally gleaned from previous performance and 'experience'. For example, manufacturing processes or system design activities. I previously covered how to reduce these risks by chopping up tasks into thin slices, as improves the variance and hence certainty.

So considering the chance of Going live on time, all tasks have to complete on time. So the probability of completing on time is simply the multiple of all the success probabilities, given these conditions:

Sequential Conditional Probabilties


So a 28% chance of completing on time!

Shock horror!

Parallel Tasks

"Cha-HAAAA! We'll just run the tasks in parallel!"...

...I hear you cry. OK, maybe not quite like that (stop with the mock Kung-fu already!). The point is, contrary to popular believe, this only improves the probability of success if running those tasks in parallel then gives each task a greater chance of completing before the GO LIVE date! After all, they all still have to complete:

parallel version of the same tasks
In this scenario, the go live can only happen when all individual components come in at the same time. Hence, we can model this with non-conditional probabilities and yet again, the chance of hitting the deadline is:

However, most of the time this does result in some improvement in probability of success, but not usually as much as you think, as workload expands to fill the time available for it (Parkinsons Law). It's what project crashing was in the original PRINCE method, but because of this darn law, it never changed the risk profile (aka probability density function) and because the tasks were so big, the uncertainty around them was extremely high anyway.

I have come across parallel tasks like this several times, where say, Task 1 is the hardware platform, Task 2 is the code and Task 3 is a data migration. This is risky!

The Solution

As per vertical slicing, the key is to segment the tasks so that each can be deployed as a separate piece of work, able to deliver value to the organisation even if the rest of the project doesn't make it, is canned, or is late. It's about breaking the dependencies all the way along the chain, so that the statistical fluctuations of ToC are removed (so if the statistical fluctuations do happen, and they will, who cares?) for those of you familiar with theory of constraints or queuing theory. Looking at how this would works:


Three separate deployments to live

This time, tasks 1, 2 and 3 all deploy functional projects into production with the same risks as before. Looking at the individual risks, they are 50%, 80% and 70% respectively. Given the overall success rate of both the previous methods was 28%, this is a significant improvement, without even considering the real life benefits of greater certainty.

You can apply this thinking to much more complex streams of work. I'll leave the following exercise for you readers out there. Take note that the conditional probability 'carried over' to the next task has obviously got to be the same for each successive task. For example, Task 1 has a 60% chance of coming in on time and hence Tasks 2 and 3 both have the same probability coming in. I know how keen you are to give this a go ;)

Give this a go!

Conclusion

As you can see, where an organisation hasn't made it to the "Mature Synergistic Mindset" that Ian Carroll introduces in his blog (i.e. vertical slices) the structuring of projects and programmes can rely very heavily on this sort of process to find where stuff goes. Risk is only one aspect to this. You can use the same technique, where the arrows map waste time (i.e. time spent in inventory) and then use say, IPFP or linear programming with appropriate constraints to find an optimum point.

However, be careful that this is an in-between technique, not the goal. The goal isn't to have the analysis, it is to make your process more efficient by reducing dependency, and the impact of statistical fluctuation on your project.

Monday, 2 June 2014

The Smaller The Better

A while ago, I wrote a couple of posts about agile estimation and specifically, how I evolve estimates as projects run. I also wrote about the #NoEstimate movement what I take away from that view of estimation.

There is also a little programming exercise I was shown once, known as 'the Elephant Carpaccio' by Alistair Cockburn. One of the agile signatories I have a lot of time for. The aim of the contemporary version is to find out how thinly you can slice an elephant (aka your code) so you can write a test, code and then deploy a tiny tiny change, perhaps even one single line, into production.

What is interesting is that the smaller the change, the less the variance on that change. I sometimes do this by asking a group of folk to estimate the size of a line, which is usually quite small (in the order of an inch or so) and then ask folk to estimate the size of a much larger [elephant sized] line. What you almost always see is the standard deviation of estimates of large line size are almost always much higher than those in the smaller ones.

You see this in both story point estimates and indeed the variance of waterfall/RUP/no-method projects as a whole. No doubt we've all been in companies where small projects haven't really been that late, or cost that much more than predicted, whilst larger, more complex projects have taken or cost several orders of magnitude more (luckily, not that many at all for me).

Now, you should know by now that I like to prove things. Using empirical data and statistics to find out perhaps useful angles on things or validate a hypothesis. This case is no exception. I am going to use a previous dataset for this, gleaned form issue tracking tickets, their estimates and the cycle time of each ticket (duration the ticket spent from being opened to being closed at done).

Basically, I am testing the hypothesis that the standard deviation of higher valued tickets is greater than lower valued ones.

Method

Taking the number of tickets, their point sizes and their durations, I constructed a table of averages versus standard deviations for all Fibbonacci sized ticket (1,2,3,5,8).

Results

The results of the analysis are shown below:


The key thing to note is that the standard deviation for a 1 point story (+ or - 1.088) is significantly smaller than any of the others, with intuitively, an 8 point story having a larger deviation.

Why Care?

This is important because if you want a level of predictability, not just with time, but with effort, cost and anything else, the indication is to make the stories as small as possible.

The key thing with agile processes, is they fall into a class of statistical process. Specifically, an Ito process, akin to Brownian motion (I know, this is where it gets sexy).

Each individual ticket can be considered to have a 'predictable' component and a random variation around that. Stochastics is more than pure probabilistic methods, either in classical statistics, where predictability is not assumed to exist at all, or Bayesian statistics (where the posterior probability is gained by improving the a priori statistic, given the presence of new empirical evidence). For devs this is like knowledge improving as you gain more knowledge of the domain, which manifests when the team 'learn' through experience (I personally think Bayesian statistics holds the greatest promise of modelling an agile development process by far. Another story for another day). Stochastics assumes there is a level of determinism and a random component which us agile practitioners could consider to be caused by sickness, additions of new folk, unforeseen circumstances, team members leaving, meddling or whatever else can affect the flow of the team.

The result of the above experiment, as well as carpaccio exercises and my 'estimate the line' game all seem to suggest that if we make the tasks as small as possible, simultaneously reduce the variance. Eventually you'll find the variance from the expected time is so small as to be negligible. So keep things small and keep your chances of success high!


Saturday, 24 May 2014

Blast from the past!

I keep coming across the same problem every so often. It's really deceptively simple. It's the calculation of averages.

You're Kidding Right?

No, but I am not referring to the calculations themselves, just the process by which we do it.

I went off down this track in the year 2000 as a 23 year old. I was working on an adaptive load balancer for a very large blue-chip insurance firm who refused to give me and my team decent hardware. OK, that's a bit harsh. The project was temporary in nature, but existed for a very political reason. To get it out of the door quickly, we had to make do with disparate hardware, so I wrote a special load balancer which adapted to the load that came in by keeping a tally of connections and adapting to the mean of the latency of the heterogeneous [mongrel] server specs we were given. It would also judge the computing agent's performance and so would route traffic to the most appropriate node given it's average performance over it's lifetime and the number of connections it currently had. It was called MAALBA (Mean Average Adaptive Load Balancing Algorithm - So very geek!).

Believe it or not, the principle of an average could have become a huge headache!

No, You Really ARE Kidding Right?

Nopety. Let me explain why. 

Look at the equation below, which calculates the average latency of a system i the standard way.


Where Li is the latency and L 'bar' is the average latency.

There are/were two things wrong with this standard average calculation in the load balancing context.

Linear Increase in Calculation Time as the System Aged
A standard average requires the sum of all samples. Each time a new entry comes in, the whole sequence had to be calculated again. This meant that as the system doubled in age, the time take to calculate the latency also doubled. 

If you have 10 items in your list, this is just 9 CPU additions and a division. 10 ops in total, no big deal at all. However, now make this 1 million items and suddenly you are running 1 million operations just to calculate an average! This would also have to happen at speed, for each and every single one request. This massively affects the performance of the load balancer and hence it's ability to route traffic to nodes in the network.   

However, this particular problem could be solved quite easily by simply keeping the running total in a variable store which was then updated as each sample came in. Great!

Summing all Latencies Leads to Overflow     
As we know, numerical types in systems have a maximum number they can store. This is usually a function of the word length. So an unsigned 32-bit system can store a maximum of 4,294,967,295. No surprise there. However, the latency of a system was in milliseconds and there would be multiple-millions of samples going through the computing array every day. So you could get to the maximum size of the integer in a very short lifetime. You could choose to use floats or doubles, but they would be equally problematic and keeping a running total would be no use in this regard, in that this is exactly the problem it causes. 

See my point?

Yes, So? Solution?

The thing with average equations, or indeed any equations which have an inductive form, is that you can convert it into what maths bods call a 'recurrence relation'. This is a relationships which uses the previous value as the baseline for the new calculation. 

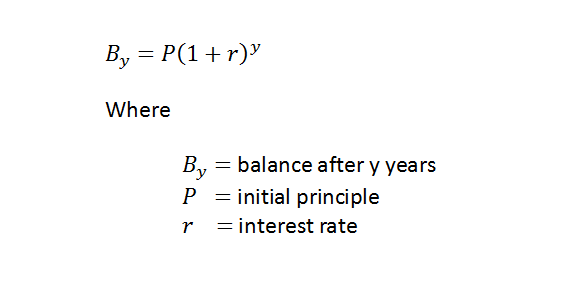
This is particularly easy to exemplify. For example, the curve of compound interest can be represented by:


Or, you can represent this through a recurrence relation by storing the previous balance, which is what Banks (and you) do and multiply this by the interest for this year.


For those astute with language, functional programming or maths, you'll notice that a recurrence relation has a continue condition, which calls an equation of itself and also an initial condition (or rather, terminal in this case) which stops the recursion when it reaches year zero. This is simply a recursive function. So the recursion calculates as it unwraps from year zero.

So Use Recursion?

No! Absolutely not! The problem with using recursion for the average equation is you still risk an overflow. Not just that, but you also risk a stack overflow because running a series of 1 million recursive calls stores 1 million stack frames on your stack, which may be 20 to 40MB or more, which for a 32-bit stack is huge! Multiply this with the parallel number of requests and the threads used and you have gigabyte of memory in use, on an OS which could only address 2GB at best, 200 MB of which is used by the OS itself. I those days, this would have killed a huge server!

No, you couldn't just use recursion. The trick is to know that unlike compound interest, which are divergent in nature (the curve never flattens out. It gets steeper) averages regress to the mean. This is a convergent process, which eventually flattens out nicely. Given that the maximum you could ever have for a latency would be the maximum value of the integer type chosen, unlike compound interest, you could never overflow! After all, if all your samples were 4,294,967,295, then dividing this by the number of samples would give you an average of 4,294,967,295. If latency was anywhere near this, we'd consider this a hung process anyway!

OK, OK What Does it Look Like? 

Solving the average calculation required me to transform the average equation into a recurrence relation and then store the previous average in memory.

To create the recurrence relation, I actually expanded the equation to release the terms necessary for the previous average:


Which then became:
The terms in the square brackets are the previous average! So we can complete this algebra by substituting the term for the previous average and we end up with:

And to reduce by one more calculation, finally:


What this means is that for any new average latency calculation, all you need do is take the previous value and perform 4 calculations on it, whatever the size of the history! This means there is no linear increase in latency to calculate the average before routing.

OK, Having Talked the Talk...

That's the theory. So how much faster does this go? 

I lost the results a long time ago, but I'll be rewriting this in code and posting it on one of my GitHub repos. The following table compares the normal .NET average against this new average calculation for extra-small (10), small (100), medium (1,000), large (10,000) and extra-large (100,000) numbers of samples, of numbers between 1 and 1,000, 1 and 3,600,000. To simulate the latency of up to an hour in each of these, request cases, we have to compare with an agent which calculates the average the traditional way for each request.

The code for the calculation of the average from the maths above is simply:


So nothing special. The test for this spike simply ran the  average and compared it to the value .NET gets through the .Average() aggregate method and sure enough:


You can see where the Resharper for VS2013 icon shows the test went green. So we're calculating the right value.

Next I ran the configuration described above and the results are shown below (in milliseconds). The Latency Ratio is just the performance of the recurrent average against .NET's average calculator:


The tests were run on a logarithmic scale. Plotting these as graphs show us how the different algorithms performed as the size of the lists got bigger.

0 to 1s samples, .NET average v recurrent

0 to 1 hr samples, .NET average v recurrent

As the system hit 100,000 items in the list, the standard average calculation failed to perform to even 1% of the speed of the recurrent algorithm.

Conclusion

As you can see from the above results, the .NET average calculations performed really poorly in the tests compared to the recurrent version of the code. So you could be forgiven for thinking I am about to tell you to ditch the .NET version. 

Far from it! The only reason this worked is because of the fact we needed to accumulate an understanding of the system which converged to a value, in this case the average, and the prior 'knowledge' the system had didn't change. If we could go back and change the numbers of historical effects, we would be stuck with a system which could only use the standard average calculation and nothing more! Since we'd have to reprocess the samples and the history each time. 

This just goes to show that an awareness of the context of an algorithm is a really importance factor in high performance systems. Unfortunately, it's one of the things you can't refactor to alone. Refactoring may given you the ability to pick out the old average calculation method to then replace with this, but not develop the algorithm for a new one such as this, especially from scratch. Anyone beating on anyone else for 'analysis paralysis' should hopefully be hanging their heads in shame at this point.

What I would like to do is illustrate the effect in multi-threaded environments. This will really show how the system performs in both sync and asych environments, as this has a direct bearing on the scalability of systems. One day I'll get round to rewriting that one :-)

Wednesday, 30 April 2014

AWS Cloud Summit 2014

I have started writing this before the start of AWS' Cloud Summit at the ExCel in London. The AWS Summit is usually a good event and as far as the big cloud players are concerned, is my favourite of the events. There is good attention to detail, lots of vendors, free food and coffee, which is always a major bonus. You get the chance to talk to some of the AWS staff and solution architects, which is always a huge bonus. This isn't going to be a live blog, as you can follow me @EtharUK for that, but at the same time, it will allow me to record some thoughts in more detail as the day progresses.

As it happens, I was at an AWS Bootstrap workshop yesterday and I am trying to hunt down a solution architect who can answer a question I had from that, Sabastian the trainer couldn't answer at the time. Best go find such a target...

Keynote

I was worried that I wouldn't be able to sit through the keynote as it was going to be two hours long. However, Steve Schmidt's presentation was actually quite informative.

Carlos from Just-Eat showing how AWS has facilitated their agility

Carlos from Just Eat was here again, but Channel 4 put in an appearance, explaining how data drives their advertising decisions, which in turn have led to an 8-fold increase in benefit to customers.

The current AWS estate


The top-level AWS service catalogue hasn't seemingly changed much from last time. That said, the number of services, which include addtios to service offerings, which I would have liked to hear more about, has increased dramatically. So much so, they didn't fit on a standard linear graph, which could have had a much stronger impact. Oh well, they're techies :o)

Schmidt showing us the mis-scaled pace of innovaiion ;)

The one thing we heard a lot more of was governance. Whilst AWS provides enough tools to deliver a reasonable level of governance, there was much more a hint around how it was being used in the enterprise sphere.


There has recently been a lot of noise about hybrid-cloud solutions. Steve Schmidt spend a little bit of time mentioning the interoperability of cloud and on premise solutions. In my experience, there is a lot more to it.

My epic fail attempt to win a Kindle

What's the answer to my question?

Yesterday I was at an AWS workshop. In it, Sabastian the trainer, mentioned that records deployed to an AWS availability zone, with a slave availability zone, would synchronously commit changes on the master and the slave. It doesn't commit this to the master until it has been committed to the slave. This gave me some cause for concern.

The aim is if the master availability zone goes down, the slave doesn't goes down. This is sensible form the point of view of the master. However, if the slave availability goes down and the master doesn't commit unless the slave also commits, then unless there is a way for RDS to commit this to the master, you have an issue. Indeed, this situation could technically result in lower availability than running single instances of the DB.

Why?

Firstly, I am pretty sure that this is DB instance independent. Assuming you have a synchronous process that requires two activities to complete successfully. However, I have not seen or heard evidence to suggest this is a two-phase commit process. So to illustrate the issue, an example might be useful.

Supposing the two cloned platforms across the two availability zones each have a 99.95% availability. For a master-slave configuration where the commit of the master is dependent on the slave, this introduces a dependency chain and means that the whole uptime of your entire platform requires both services to be up in certain configurations. The result is this reduces the availability to about 99.90% (i.e. the probability of both systems being up). This is lower than any single server and certainly lower than systems running independently in parallel.

This doesn't mean that it is a problem. After all, you can architect to remove this risk and hence increase the availability of the data sources as a whole. However, I put this to our trainer yesterday and he said he'd go away and ask. Hence, I didn't receive an answer at the time.

I spoke to a solution architect this morning and he too didn't have an answer. So it would be good to get one. I am not too bothered whether it is positive or negative, but it would dictate the complexity of a system design and also provide a theoretical constraint to conduct trade-offs around . Known-unknowns can be troublesome, especially if you've only just discovered it, since it was an unknown-unknown before. I must get round to chasing this up.

**** UPDATE: After chasing this up, it appears that there isn't currently any documentation to corroborate the assertion from a few other SAs that the platform would prevent the saving of data in the event of an AZ failure. However, this also doesn't tell me if it wouldn't. I've had my details taken but no sticker given ;) ****

400 - EBS and EC2 Optimisation

This was a 400 track. There were some extremely useful slides in this track. AWS went through an intro explaining that EBS is basically a storage mechanism with a queue attached and is not like a normal disk. I still think it kind of is, when you include the buffers and caches. Both standard EBS and EBS PIOPS (Provisioned IOPS) were introduced and in the latter case, we briefly touched on the configuration of the IOPS provision.

However, importantly for me, the existence of a formal queue defines a specific need to understand the block size per IOP, as this can significantly affect the throughput of the system. The bigger the ECS instance, the more you can write (specifically, the faster you can write the data), the bigger the EBS queue, the faster it can write the standard 16K blocks.

This suggests that the best way to write the data to disk is to chunk them up in 16K blocks (or multiples thereof) and write them in parallel, which was suggested in yesterday's workshop.

200 - Hybrid Environments with AWS

This was an interesting track, however most of this is pretty standard. For indeed, some of my clients have done this for a while. I have a much greater appreciation of this via some of the security group work I've done since last year. So I am liking the way that hybrid and cloud solutions can work together. There didn't seem to be too much that was new though.

Hybrid Environments - Yes, I was a bit late to this one :-S


300 - Building for availability and cost

Fitz, a solution architect at Amazon presented Here.com's autoscaling solution. Through all Autoscaling demos at this conference, the mantra "scale up fast, scale down slow" was repeated. This is because it takes little time to prevent an AWS EC2 instance from receiving traffic, but it can take an age for it to get to a position to receive traffic. So that makes sense.

End of Day

Not a bad summit. I don't think I will take away as much from this as I did last year... aside from that my weight isn't appropriate for perspex chairs (Sorry Amazon). Amazon always put on a very good show. I'm sat here with a beer whilst I prep to tackle the tube 'struck' TFL public transport system before getting my train to Manchester. There is a lot to take away and I'll have to let that lot ferment as much as the beer before brewing up a new vat of ideas for the future of my architecture work with the new tools AWS provide. I am still to be convinced of the some of them, such as the need for schedule based autoscaling, which I see as a way to circumvent the 15 or 20 minute spin up of a new platform. However, they do solve some problems so are not at all without purpose. Especially in warming up environments for immediate use. 

Additionally, the EBS optimisation session has set off a few ideas around using queuing theory to try to explain some of the numbers Amazon have found in their testing. One thing that appeared time and time again was the experience of other speakers, a large proportion of whom spent a lot of time and effort creating PoC platforms to prove the viability of AWS.

Friday, 11 April 2014

Google Cloud Platform Roadshow: Manchester

Welcome landing slide


I had the good fortune to be at Google's Cloud Platform Developer Roadshow, which kicked off in Manchester's TechHub this week. The combination of my early arrival, never having visited the old TechHub building, not being able to get into the new building, the TechHub website still showing the old address, Google showing the new one did make for an interesting rush as I did wonder where I was supposed to be. When I then incorrectly found myself back at the old TechHub offices, I wasn't alone it seemed as I met a few students who also didn't get that memo :)

In the end, we got ourselves back and were rewarded with coffee and breakfast pastries, which given I hadn't had breakfast, more than made up for it. Even if It did mean my name badge curled up almost instantly due to the amount of very brisk walking my 118kg frame (+7kg laptop bag) had done back and forth.

Curled up name-badge worn by Mr Radiator :-/
Having lost my original seat, I then initially got relegated to the cheap seats, so figured I best move :)

Not a great view :-D

Introduction to Beer and Salvation

Doug Ward (@SimplyDoug1987 on twitter) ran through the usual housekeeping and informed us that we mustn't stop to collect personal belongings but to save the beer. I thought that was a good point as nobody usually likes a warm beer. But as as Brad Abrams, Group Product Manager introduced the agenda, the Fireside chat did make me wonder if avoiding warm beers were really the motivation to save them after all :)

Doug Ward keeping house


Keynote

Brad Abrams ran us through a quick whirlwind of the Google platform. I was pretty familiar with this already, though I don't use Google AppEngine much. I overheard Brad talking to a group and mentioning that they are in the process of supporting SQL Server 2008 R2. Not quite clear as to how as yet myself. Still quite intrigued and so I gather, was Mandy Waite when I approached her about it towards the end of the day.

Google's Cloud offering


Developer Advocates Mandy Waite and Laurence Moroney joined Brad after he presented the agenda, to walk us through a number of deep-dive demos of Google's AppEngine, including presenting the new OnDemand pricing and Sustained Use discounts for any usage over 25% of the month on each platform. This is a very useful discount and after I questioned Brad on whether or not it had to run continuously, he confirmed that it didn't. It just had to use 25% of the 10 minute blocks of a whole month of OnDemand use.

New Google AppEngine Pricing Model


For those outside the Microsoft sphere, together with the drop in OnDeman pricing, this suddenly makes the Google AppEngine a very attractive proposition. I intend to cover why in a later blog post, but like other models on the market, this has the ability to create a maximum amount of compute and storage costs that you have to pay per month, but applies it on what you actually use, unlike AWS and Azure, where you either commit to reserved instance pricing, or 6 to 12 month blocks up-front, which hits agility and also fixes your discount to a level above your real OnDemand usage (if you pay up-front and use significantly less than you forecast). See the Moz story for an example (though this appeared to be an issue with technical best-practise and inefficient use of AWS, which in my experience of PR and marketing agencies, is unfortunately all too common an occurrence).

The focus was very much on mobile development and there was a lot of mobile developers in the audience as well as some familiar faces on the Manchester tech scene (See the back of Saftag's head below).

Shaf Chaudry showing sponsors around  before the start

Demos

Mandy and Brad ran through the creation of a Sudoku solver and Meme Maker using Python, this was supplemented with an Andoird App written in Android Studio (which by the way, I really like! It's much better than Eclipse, which I've done a bit of work in before, and brings a lot of Resharper like functions to the IDE - which I really missed in Eclipse). Requests were made through JSON secured with OAuth tokens.

Mandy and Laurence both demo'ed the boilerplate for hosting through the AppEngine API, demonstrating the use of Python scripts and the gcloud CLI tool to manage the OAuth keys (which is a much more long long winded process) and testing functions through Google's Developer Console. I've used this before to generate requests and test access to Calendar info for some .NET projects I've done and to be honest, it's best of breed at the moment in this particular area, but AWS still hold the balance of power across the board IMO.

Brad explained that the environment gives Google developers a free Git instance and runs your unit tests if you have them. This then displays the results in the console for you to check on. This is a pre-ested commit (gated check-in) so if it fails, it doesn't deploy to live. This is nice, but AWS also has a free git instance. The key difference is that Google's Cloud Developer console has in browser editing, which automatically runs the tests again and deploys it to live, but also puts it in the Git repo for your team (or another dev team) to pull later. This is crucial, as cross team development needs up-to-date and common code bases to use and the ability to force changes for DevOps/App Support staff, but still maintain the consistency of the code base is essential!

Brad and Mandy run through the storage of images in buckets for the meme-maker demo app

Conclusion

All in all, there was a good number of take-aways. Given my current working platform (Microsoft) I don't see myself changing off AWS any time soon. That said, the MS hold has more or less lipped away from a large number of small business and start-up community groups. So I can see this featuring very heavily in interaction with those markets going forward.

Google AppEngine definitely offers a good (and quick) alternative to AWS if you want to host OSS platforms. I think they're still a little slow on the release of new language support, as they pretty much had the same languages on offer as two years ago. That said, there are some very nice touches in AppEngine, such as the ability to SSH into your Linux VMs and work on them locally. However, if your main work is PHP, Java and especially Python, you can be up and running with a fast platform, very quickly and cheaply.

All in all, a good half-day. The beers didn't need saving either :)